


Response Rate Calculator
Use-case for the Response Rate Calculator
Context
You’re a marketing coordinator at an online retail company. You are responsible for conducting customer satisfaction surveys to gather feedback on recent purchases.
You send out these surveys via email to ensure customers are satisfied and to identify areas for improvement. Despite sending out numerous surveys, you notice that you have a low response rate which limits the insights you can gain from customer feedback.
The problem you face
You face the challenge of a low response rate for your surveys. Without sufficient responses, it's difficult to get a clear understanding of customer satisfaction and identify trends or areas that need improvement. This lack of feedback can hinder the company's ability to enhance the customer experience and make informed business decisions.
Application of response rates
You decide to use Fairing’s Response Rate Calculator to measure the effectiveness of your survey campaigns. By calculating the response rate, you can determine the percentage of recipients who completed the survey out of the total number of emails sent.
The problem you face
This metric helps you to evaluate the success of your survey campaigns and identify factors that may be contributing to the low response rate.
Using the Response Rate Calculator
The Response Rate Calculator requires you to input the total number of survey emails sent and the number of completed responses received.
For example, if you sent out 1,000 survey emails and received 150 responses, the calculator shows a response rate of 15%. This clear, quantifiable metric provides a benchmark to assess the effectiveness of your survey campaigns and make necessary adjustments.
Response rates
What is it?
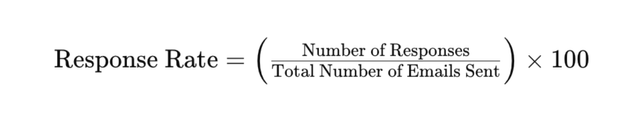
Response rate is a metric that measures the percentage of recipients who respond to a survey, email, or other forms of outreach. It is calculated by dividing the number of responses received by the total number of invitations sent and then multiplying by 100 to get a percentage. This metric is crucial because it indicates the level of engagement and interest your audience has in your communications.
Response rate is a valuable indicator of how well your email or survey content resonates with your audience and whether your outreach efforts are effective.
What your response rates tell you
- Engagement Level: A high response rate indicates that your audience is highly engaged and finds your content relevant and compelling. It suggests that your emails or surveys are capturing their attention and prompting them to take action. Conversely, a low response rate can signal disinterest or issues with how the message is being delivered. It may indicate that your subject lines are not compelling enough, your content is not relevant, or your timing is off.
- Content Relevance: Response rates provide insights into how well your content resonates with your audience. If certain topics or questions consistently yield higher response rates, it indicates that those areas are of greater interest or importance to your audience. This information can guide you in creating more targeted and engaging content in the future.
- Survey Design: The design and structure of your survey can significantly impact the response rate. A clear, concise, and well-structured survey is more likely to elicit responses than a lengthy or confusing one. If you notice a high abandonment rate in your surveys, it may be time to simplify your questions or shorten the overall length.
- Audience Quality: A consistently low response rate might also point to issues with the quality of your email list or survey sample. It may indicate that your list contains outdated or irrelevant contacts who are no longer interested in your communications. Regularly cleaning and updating your email list can help improve response rates.
Using your response rates for your business
- Optimize Survey Design: Analyzing which surveys have higher response rates can help you identify common characteristics such as length, question type, or topic. Use these insights to design more effective surveys in the future. For instance, if shorter surveys with multiple-choice questions receive higher response rates, consider using this format more often.
- Improve Timing: Determine the best times to send surveys or emails by analyzing when response rates are highest. Timing your outreach correctly can significantly increase engagement. For example, if you find that response rates are higher for emails sent on Tuesday mornings, you might focus your email campaigns around this time.
- Enhance Audience Segmentation: Use response rate data to segment your audience based on engagement levels. Tailor your communication strategies to different segments to improve overall response rates. For instance, highly engaged segments might receive more frequent and detailed surveys, while less engaged segments might receive shorter, more concise communications to gradually increase their engagement.
- Refine Communication Strategies: Continuously monitor response rates and adjust your communication strategies based on what works best. This can involve experimenting with different email subject lines, survey questions, or sending times. For example, if response rates improve with more personalized subject lines, incorporate this practice into your regular email strategy.
- Increase Customer Satisfaction: By analyzing response rates, you can identify areas where your products, services, or customer interactions may need improvement. High response rates often correlate with high customer satisfaction, while low response rates might highlight dissatisfaction or disinterest. Use this data to make informed decisions that enhance customer satisfaction and loyalty.
- Benchmark Performance: Response rate data can serve as a benchmark to measure the effectiveness of your email and survey campaigns over time. By tracking changes in response rates, you can assess the impact of different strategies and continuously refine your approach to achieve better results.
Understanding and effectively utilizing response rate data can lead to more successful email marketing and survey campaigns. It allows businesses to make data-driven decisions, optimize their strategies, and ultimately achieve higher engagement and satisfaction levels among their audience. The Response Rate Calculator is a valuable tool for measuring and improving these metrics, helping eCommerce businesses enhance their marketing efforts and achieve better outcomes.
Response rates vs completion rates
While response rates measure the percentage of recipients who start a survey or respond to an email, completion rates measure the percentage of respondents who complete the survey.
- Response Rate: Indicates the initial engagement level and willingness of recipients to participate.
- Completion Rate: Reflects the effectiveness of the survey design and the respondents’ level of interest in completing it.
Both metrics are important for understanding overall engagement and survey effectiveness. A high response rate with a low completion rate may indicate issues with the survey's length or complexity.

For example, if you spend $1,000 on a marketing campaign and generate $2,000 in profit from it, your ROI is:
How to calculate response rates
Calculating response rates is straightforward. The formula is:
For example, if you send 1,000 emails and receive 200 responses, the response rate is:
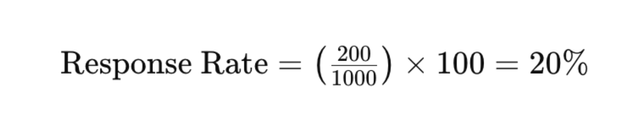
Using this calculation, businesses can quickly assess the effectiveness of their survey or email campaigns.
Response rate vs other metrics
While response rates are an important metric, it should be considered alongside other email marketing metrics for a comprehensive view of campaign performance:
- Open Rate: Measures the percentage of recipients who open an email. High open rates are necessary for high response rates.
- Click-Through Rate (CTR): Measures the percentage of recipients who clicked on links within the email. It indicates the effectiveness of the email content and calls to action.
- Conversion Rate: Measures the percentage of recipients who completed a desired action, such as making a purchase, after clicking through the email.
- Bounce Rate: Indicates the percentage of emails that were not successfully delivered. High bounce rates can affect overall deliverability and open rates.
- Unsubscribe Rate: Measures the percentage of recipients who opt out of your email list. A high unsubscribe rate may indicate issues with content relevance or frequency.
Ways to improve your response rates
- Craft Compelling Subject Lines: The subject line is the first thing recipients see. Make it intriguing and relevant to encourage opens and responses. Use clear, concise language and consider personalization to catch the recipient’s attention.
- Personalize Emails: Tailor your emails based on the recipient’s preferences, past interactions, or demographics. Personalized emails that address the recipient by name and reference their interests are more likely to elicit responses.
- Optimize Send Times: Determine the best times to send emails by analyzing when your audience is most active. Sending emails at optimal times can significantly increase response rates.
- Segment Your Audience: Segment your email list based on criteria such as demographics, past behavior, or engagement levels. Tailored content for each segment is more likely to resonate and encourage responses.
- Design User-Friendly Surveys: Ensure your surveys are concise, well-structured, and easy to complete. Avoid lengthy questions and use a mix of question types to keep respondents engaged.
- A/B Test Emails: Experiment with different email elements such as subject lines, content, and calls to action to see what drives higher response rates. Use the insights gained from A/B testing to refine your approach.
- Provide Incentives: Offering incentives such as discounts, gift cards, or entry into a prize draw can motivate recipients to complete your surveys. Ensure that the incentive is relevant and appealing to your audience.
Using your response rate numbers to guide your actions
- Identify Trends: Use response rate data to identify trends and patterns in engagement. This can help you understand what works and what doesn’t, allowing you to adjust your strategies accordingly.
- Optimize Future Campaigns: Apply the insights gained from analyzing response rates to optimize future email and survey campaigns. Continuously refine your approach based on what drives higher response rates.
- Enhance Customer Engagement: Use high response rates as an indicator of successful engagement strategies. Leverage these strategies to maintain and enhance customer engagement over time.
By understanding and effectively using response rate data, businesses can enhance their email marketing campaigns, improve engagement, and make more informed decisions. The Response Rate Calculator can help eCommerce businesses measure their performance and identify areas for improvement, leading to more successful marketing efforts.
Explore Fairing's B2B SaaS solutions for eCommerce to see how we can help your business thrive. Book a demo today, or check out our 1-minute product demo to learn more!
