


Fairing's Confidence Interval Calculator
Use-cases for a confidence interval calculator
Imagine you are an eCommerce merchant who sells organic skincare products. Recently, you launched a new line of organic face creams and want to ensure you have enough stock to meet demand without overstocking, which could lead to unnecessary storage costs or product expiration.
You decide to use a confidence interval calculator to estimate future demand based on initial sales data. This involves understanding the population mean of daily sales, and calculating the confidence interval around this mean, using statistical analysis.
Such a tool has many names: confidence interval estimate calculator, population confidence interval calculator, an interval estimate calculator, or simply, a sample confidence interval calculator.
Step-by-Step Process
-
Over the first month, you collect daily sales data of the new face cream.
-
Calculate the 95% Confidence Interval:
-
Using the confidence interval formula (for a 95% confidence interval),
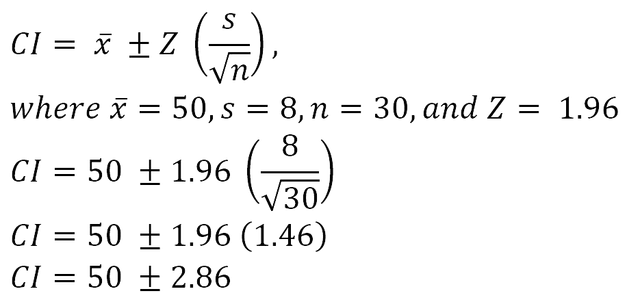
- Where Z is the Z-score corresponding to the desired confidence level, s is the standard deviation, and n is the sample size.
- this results in a confidence interval of (47.14, 52.86).
-
-
Interpret the Results:
With 95% confidence, you can say that the true average daily sales of your new face cream lie between 47.14 and 52.86 units. This interval estimate provides a range for the population mean of daily sales.
-
Make Inventory Decisions:
Based on this interval, you can plan your inventory to ensure you have at least 53 units available each day to meet the upper estimate of demand.
This helps avoid stockouts and ensures customer satisfaction while minimizing the risk of overstocking.
By using the confidence interval calculator, you can make data-driven decisions about inventory levels, optimizing stock and reducing costs.

What is the Confidence Interval?
When you make an estimate in statistics, there is always uncertainty around that estimate. This is because the number is based on a sample of the population you are studying, rather than the entire population.
A confidence interval is a range of values derived from sample data that you expect your estimate to fall between a certain percentage of the time if you run your experiment again or re-sample the population in the same way. It is likely to contain the value of an unknown population parameter. This range is calculated so that it has a specified probability of containing the parameter.
For instance, a 95% confidence interval means we can be 95% confident that the interval contains the true population parameter.
Confidence intervals provide a measure of uncertainty around a sample estimate, helping businesses and researchers understand the precision and reliability of their data.
The confidence level is the range of values, or percentage of times, that you expect your estimate to fall between the upper and lower bounds of the confidence interval if you run your experiment again or re-sample the population in the same way.
Samples and Populations in Statistics
What Are Samples in Statistics?
A sample is a subset of individuals or observations taken from a larger group (the population) that is used to estimate characteristics of the whole group. Samples are used because it is often impractical or impossible to study an entire population.
What Are Populations in Statistics?
A population includes all members or observations of a defined group that a researcher is interested in studying. This could be the total number of people in a city, all the products in a warehouse, or every transaction in a given period.
Difference Between Samples and Populations
- Population: The complete set of all possible observations or members that meet a set of criteria. Example: All customers who purchased from your online store in the past year.
- Sample: A smaller group selected from the population, intended to represent the population accurately. Example: 200 randomly chosen customers from the entire customer base.
Why We Need to Use Samples
Using samples is essential because:
- Feasibility: Collecting data from an entire population is often impractical due to time, cost, and logistical constraints.
- Efficiency: Samples allow researchers to gather data more quickly and analyze it more efficiently.
- Accuracy: Properly selected samples can provide accurate estimates of population parameters, allowing for generalizations about the population.
- Statistical Inference: Samples are used to make inferences about population characteristics through statistical analysis, enabling businesses to make data-driven decisions.
How to Calculate Confidence Intervals
95% Confidence Interval Calculator
A 95% confidence interval is one of the most commonly used intervals in statistics.
It provides a range within which we can be 95% certain the true population parameter lies. To calculate a 95% confidence interval, you typically use the formula:

For those without a standard deviation, Fairing’s confidence interval calculator without standard deviation allows you to use an estimated or known value to complete your calculations.
90% Confidence Interval Calculator
A 90% confidence interval provides a narrower range than a 95% interval but with slightly less confidence (90%). The formula is similar but uses a Z-value corresponding to the 90% confidence level, which is 1.645.
This can be particularly useful when you need a more precise estimate and are willing to accept a lower confidence level.
Others
Beyond 90% and 95%, confidence intervals can be calculated for any confidence level, such as 99%, 80%, etc. The choice of confidence level depends on the balance between precision and certainty that suits your specific needs. Fairing’s confidence interval calculator can easily adjust to calculate any desired confidence interval.
What Do Confidence Intervals Tell You?
Confidence intervals offer several key insights:
- Precision of Estimate: A narrow confidence interval indicates a more precise estimate, while a wide interval suggests greater variability in the data.
- Range of Values: It provides a range within which the true population parameter is likely to lie.
- Statistical Significance: If a confidence interval for a difference between groups does not include zero, it suggests a statistically significant difference.
Why People Use Confidence Intervals and How You Can Use Them
Confidence intervals are invaluable for:
- Decision Making: Businesses can make more informed decisions based on the range of possible outcomes.
- Risk Assessment: Understanding the range of potential values helps in assessing risks.
- Comparative Analysis: Comparing confidence intervals between groups or over time helps identify significant changes or differences.
For instance, if you’re launching a new product and want to estimate its expected sales, using a 95% confidence interval calculator provides a range of potential sales figures, helping you plan for different scenarios.
Z-Value for Confidence Interval
The Z-value is a critical component in calculating confidence intervals. It represents the number of standard deviations a point is from the statistical mean in a standard normal distribution.
Common Z-values, and the ones we have in our calculator, include:
- 1.440 for a 85% confidence level
- 1.645 for a 90% confidence level
- 1.96 for a 95% confidence level
- 2.576 for a 99% confidence level
- 2.807 for a 99.5% confidence level
- 3.291 for a 99.9% confidence level
These values will adjust the width of the confidence interval based on the desired level of confidence.
T-Tests
When the sample size is small or the population standard deviation is unknown, a t-test is used instead of a Z-test. The t-test uses the t-distribution, which accounts for the additional uncertainty in small samples. The formula for the confidence interval using the t-distribution is:

where 𝑡 is the t-value from the t-distribution table corresponding to the desired confidence level and degrees of freedom (n-1).
Fairing’s Confidence Interval Calculator is a powerful tool for businesses looking to understand their data's uncertainty and make more informed decisions. Whether you need a 95% confidence interval estimate calculator, a 90% confidence interval estimate calculator, Fairing has you covered.
By understanding and applying confidence intervals, businesses can gain deeper insights, assess risks more effectively, and ultimately drive better outcomes. Explore our Confidence Interval Calculator today and take the next step in data-driven decision-making for your business.
Explore Fairing's B2B SaaS solutions for eCommerce to see how we can help your business thrive. Book a demo today, or check out our 1-minute product demo to learn more!
Ready to know your customers better?
Book a demo