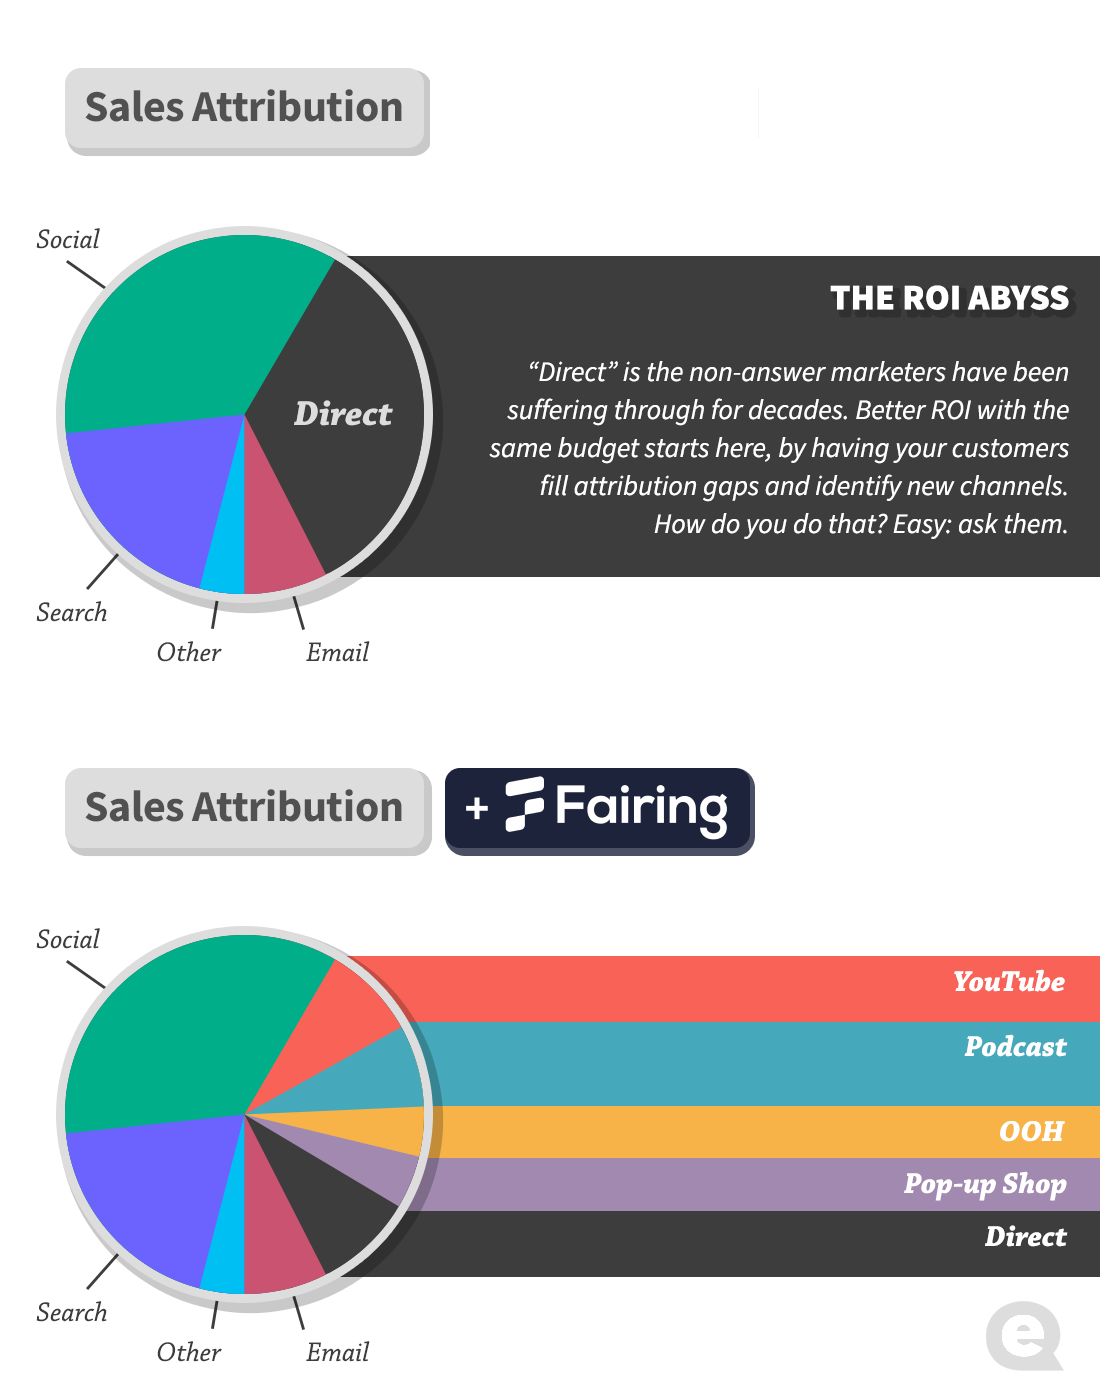
Wisdom tells us that if you can't measure something, you can't improve it. And yet, when it comes to attribution, a core component of a marketing strategy, brands often operate under a rather hypocritical duality: if a channel provides attribution, those numbers are gospel. If a channel doesn’t provide attribution, it’s no big deal.
Perhaps a better practice would be to quantify attribution internally and independently. Such a benchmark could assist in pricing unorthodox ad formats, recalibrating the ROI of misreporting channels, and measuring the impact of discovering the sources underneath your mysterious slice of direct traffic.
That’s precisely the epiphany some of our customers are reaching, now that the post-purchase surveys they’ve launched are revealing a bigger attribution picture. So, how are they quantifying the value of attribution itself? Here are a few of the approaches we’ve seen:
1. The Broken Pixel Approach
Imagine a hypothetical (or perhaps, not so hypothetical) situation where one of your major digital platforms started spitting out blatantly inaccurate attribution reporting—so inaccurate that you no longer felt comfortable measuring ROI on that platform. In that scenario, how much of a discount would you demand in order to continue using a platform that couldn’t provide attribution? It’s a subjective number of course, but it's worth asking your team to see if you can reach a useful consensus.
With that “unattributable” CPM discount in hand, you can examine your broader traffic metrics and quantify waste. For instance, if 35% of your brand’s traffic arrives unattributed (e.g., direct or other), and you’ve identified that unattributable CPMs should hypothetically cost 20% less, then you’re looking at 7% of your total marketing spend going to waste at the hands of invisible attribution.
2. The Alternative Reality Approach
It wasn’t too long ago that the advertising industry attributed ROI based on virtually useless data points such as “circulation”. Well, hop in your time machine and bring your budget with you: how would you allocate your spend in a world where there was no digital attribution?
This is another subjective scenario, wherein you could reflect on the spend shifts you’d make if pixel & click attribution no longer existed and surmise that the delta equals the value of attribution. In other words, if your current mix has 40% of the marketing budget going to Facebook, and you wager that might drop 10 points to 30% in a world without digital attribution, then it could be said that 25% of the value you see in Facebook advertising comes from its attribution.
3. The ROI Reflection Approach
There’s a more objective route to take in quantifying attribution’s value, and it involves observing the impact of our post-purchase survey on ROI.
Let’s say your entire marketing budget yields 5x blended ROI, and like most brands, you also have a huge chunk of unattributed sales dragging down that ROI—around 35% of all purchases, for many DTC brands.

Now, plug a Fairing post-purchase attribution survey onto your order confirmation page, and see how much of that mystery 35% gets revealed. Let’s take a modest client outcome and estimate that 10 of those 35 percentage points now find their proper attribution through the survey responses. The result is that your ROI metric increases from 5x to 6.3x.
Of course at the bottom line, this bump in ROI isn’t changing the brand’s profitability (though it does obviously better inform decisions about marketing mix). But from the Marketing department’s perspective, the top line impact on a P&L is very real. With an example budget of $500k in this scenario, Marketing’s top line performance would increase from $2.5mm to $3.15mm, claiming an additional $650k in revenue. That’s significant ammunition in a P&L meeting.
Have you been toying around with quantifying attribution? Any thoughts on how to improve some of these formulas we’ve seen? Send us a message—we’d love to hear your thoughts.


