


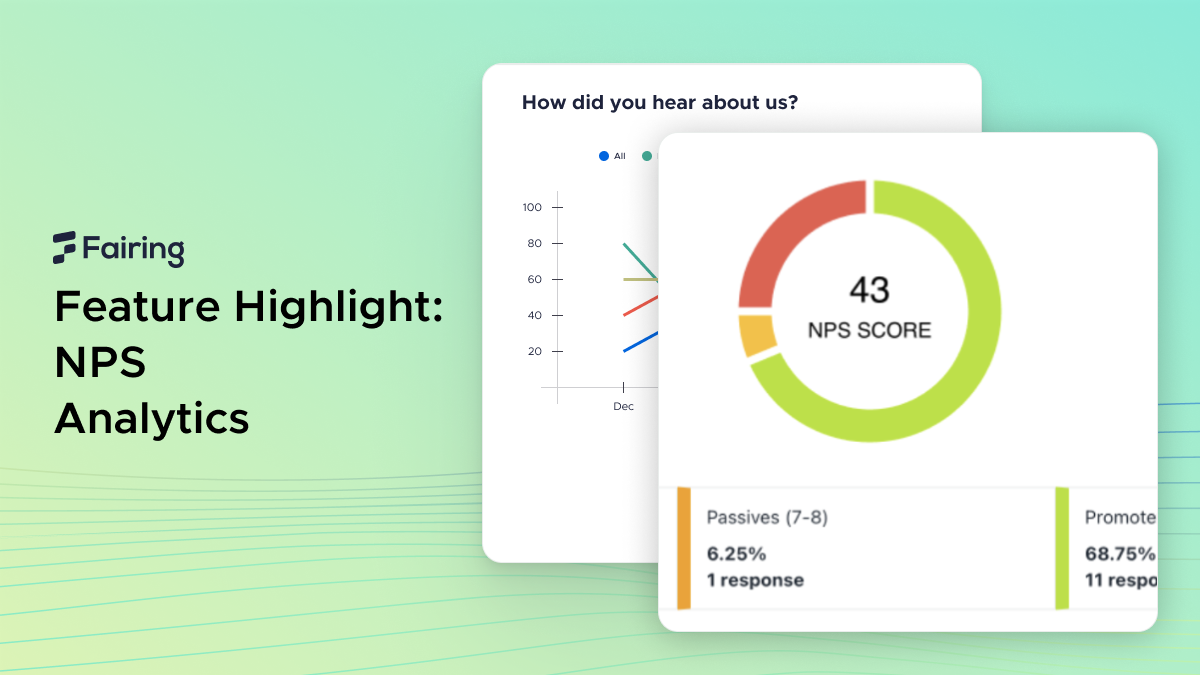
Feature Highlight: NPS Analytics
What is Net Promoter Score (NPS)?
Net Promoter Score (NPS) is a measure used to gauge customer loyalty, satisfaction, and enthusiasm with a company.
This simple yet powerful score is calculated by asking your customers one similarly simple yet powerful question: “On a scale from 0 to 10, how likely are you to recommend our product/company to a friend or colleague?”
Use case: Improving low NPS
When starting out a new business, Net Promoter Scores (NPS) aren't typically a main focus. The purpose of achieving a good NPS score, as mentioned above, simply doesn’t suit the business at that point in time.
So for this example, let’s say you’re a business owner who has been running your Shopify store for almost a year now. You sell consumer goods, and your business has been growing steadily. You’ve overcome the initial barrier to entry and now have a good rhythm going, and want to bring your business to the next stage.
In your research in learning how to do so, you come across NPS as one possible tactic for elevating your business. You identify that improving customer loyalty and satisfaction could be a crucial factor because from your HDYHAU survey questions, you find that a sizable portion of your customers heard about you from their friends and family.
For that, you introduce an NPS question to your post-purchase survey to first find out your NPS score. After a set time period and gathering enough data, to your horror, you find that your NPS score is low. It sits at a measly 3 out of 10 on aggregate.
This highlights a significant problem as this could mean that a lot of your customers don’t return, or are unlikely to promote your business to others. This could potentially be holding your business back, especially considering that word of mouth is quite important to you.
Diving deeper into your NPS score and using NPS analytics, you can see qualitative reasons why your customers are rating it so low. You find that a lot of your customers are unhappy with the lack of customer support. Apparently, many have written in about issues with their items but either never got a reply or waited really long for one.
With this information you brainstorm solutions, and ultimately decide to hire an additional team member to support on that front. You hope that with someone focused entirely on customer support, you will be able to boost your NPS score.
Setting this into motion, you now can use Time Analytics to monitor your progress. With these kinds of issues, the effects take time to be felt. Over the course of the next 3 months, you routinely monitor your NPS score and see that there’s been gradual improvement.
From there, you can continue to monitor for any other issues raised with your NPS and create strategies accordingly. NPS analytics makes this entire process significantly easier.
How NPS is measured
At Fairing (and across most of the industry), we use a 0-10 scale instead of the traditional 1-X. This is to help capture the true midpoint. With 0-10, there's no need for additional data analysis to determine the midpoint.
NPS is calculated by subtracting the percentage of customers who answer the NPS question with a 6 or lower (known as ‘detractors’) from the percentage of customers who answer with a 9 or 10 (known as ‘promoters’). More information about detractors and promoters will be covered below.
This broader range helps mitigate measurement bias. On a narrow 3-point scale, many people tend to gravitate towards the middle response, even if their opinions vary widely. We want to give your customers room to express themselves authentically.
NPS data analysis is typically done by businesses to understand customer sentiment and loyalty towards their brand. As such, a general rule of thumb is that it should always be targeted at returning customers.
Segmentation
Promoters (score of 9 and 10) are a company’s most enthusiastic and loyal customers. They are likely to act as brand ambassadors, enhance a brand’s online reputation, and increase referral flows. These all serve to fuel the company's growth.
Passives (score of 7 or 8), as the name suggests, are passive about the brand. They are not actively recommending a brand, but are also unlikely to damage it with negative word of mouth. Although they are not included in the NPS calculation, passives are very close to being promoters, so it makes strategic sense to spend time investigating what to do to win them over.
Detractors (score of 0 to 6, included) are unlikely to recommend a company or product to others. They probably also won’t stick around or repeat purchases, and could even actively discourage potential customers away from your business.
These groupings are one way how NPS is typically looked at. Fairing data gives you a quick snapshot of each group.
Aggregate Scores
Your aggregated scores are the key metric to look at when looking at your NPS. For many businesses, the NPS score is even their north-star. This could be used to measure improvements in areas like word-of-mouth, something many used to consider unmeasurable.
Tracking your NPS score serves as an indicator for your business. It could be a signal to improve upon service, customer support, and so on, to improve factors like brand loyalty.
With Fairing, you’ll be able to dig deeper into the numbers. Get qualitative insights from your post-purchase survey questions to gain an understanding of why your customers gave their scores. Use those insights to power your future campaigns.
How Fairing helps your brand calculate NPS easily
Product feature
This feature was created with merchants in mind.
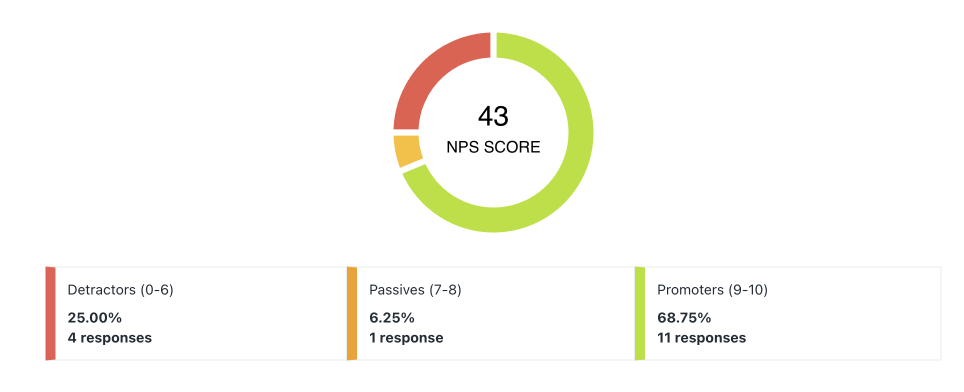
For quick and easy viewing, the NPS score, detractor, passive, promoter numbers are displayed clearly in the analytics dashboard. When viewing analytics for an NPS question type, you will see the number and percent of Detractors (0-6), Passives (7-8) and Promoters (9-10) as well as NPS score (% Promoters - % Detractors).
This aims to ensure that your business can get your key numbers instantly. It also serves to make your NPS optimization process detailed and integrated.
Additional feature—Time series

Inside your analytics dashboard, when the toggle is switched from 'Metrics' to 'Time Series', you will see your NPS score charted over time.
This time range is dictated by the date picking fields you have at the top of the screen. This means that you have the option to aggregate the data by Day, Week, or Month, within that time range. You have the flexibility and option to view and calculate your NPS scores according to the time period you want, as long as it’s within range.
A tooltip is also available when hovering over each available data point to summarize the data shown for that aggregation bucket.
Why use NPS through Fairing?
Fairing has a plethora of features that stand to bring your business exponential gain. NPS Analytics is but one of many features included, all of which can unlock key insights. This means greater cost savings for your business, where Fairing can be an all-in-one solution to any and all attribution problems you have.
Fairing’s attribution survey boasts that for the average client, they will receive at least a 60% response rate. That offers you a stark improvement from the average survey, where statistics have shown to only give a 30-40% response rate.
Fairing’s targeting functionality also lets you target by SKU or by whether they’re new or returning to purchase. Targeting by SKU lets you pivot your data by item purchased, potentially uncovering insights on the relationship between NPS and product purchased. On the other hand, brands will most likely want to ask an NPS question to returning customers after they’ve had the chance to try the product.
Fairing’s Question Stream allows them to prioritize questions like an attribution question, before asking about NPS seamlessly and as part of the checkout experience, leading to higher response rates and more data.
Want to learn how to set up your post-purchase survey for your brand? Read more here.
