HDYHAU survey Guide
The Missing Signal: How to Use HDYHAU Attribution Surveys to Unlock Strategic Growth

The Missing Signal: How to Use HDYHAU Attribution Surveys to Unlock Strategic Growth
Attribution Is Broken, But Modern Teams Know How to Find the Answers.

KEY TAKEAWAYS
What Modern Brands Need to Know About HDYHAU
An HDYHAU attribution survey is a post-purchase or post-conversion survey that asks customers "How did you hear about us?" to capture self-reported data about which channels and touch-points influenced their decision to buy or convert.
Privacy changes like iOS 14, which reduced trackable conversions by an estimated 30-40% for many advertisers, have created significant blind spots that traditional attribution tools cannot address.
Attribution surveys capture influence from hard-to-measure channels: including influencers, podcasts, word-of-mouth, TV ads, and creator content (e.g. Youtube creators) - that drive up to 70% of brand discovery but rarely appear in platform dashboards.
In-moment survey placement, such as post-purchase, achieves response rates 10 times higher than delayed email or SMS surveys, with top-performing brands seeing 45-85% completion rates.
If more than 10% of survey responses fall under "Other," your answer options need refinement to capture emerging channels and customer language accurately.
High-performing teams review free-text responses monthly and update their attribution taxonomy quarterly to keep insights aligned with evolving buyer behavior.
Layering survey data with customer lifetime value, incrementality testing, and clickstream analysis creates a triangulated view that drives confident budget allocation decisions.
INTRODUCTION
Attribution Is Broken. But Modern Teams Know How to Find the Answers.
Attribution surveys matter because they capture the one thing your measurement stack cannot: the customer's own account of what influenced their purchase decision. An HDYHAU attribution survey (short for "How did you hear about us?") is a post-purchase or post-conversion survey that asks customers directly which channels, touch-points, or moments led them to discover and buy from your brand: surfacing insights that platform-based tracking consistently misses.
Marketing attribution |
|---|
The process of identifying and assigning credit to the channels, touchpoints, and moments that contribute to a customer’s decision to take action, such as making a purchase. |
Privacy changes, signal loss from platform shifts like iOS 14 (which reduced trackable conversions by an estimated 30-40% for many advertisers according to industry analyses), and growing blind spots across the buyer journey have changed the rules of digital measurement. Entire touchpoints now happen beyond the reach of traditional tracking. Device switching, from mobile to desktop and back, can sever the trail of attribution completely.
Many of the channels that drive users to take action most (e.g., podcast mentions, TV spots, AI recommendations (e.g. ChatGPT), influencer posts) don't show up in your dashboards. And when attribution breaks down, so does confidence in spend, channel strategy, and your team's ability to defend and double down on what's working best.
For marketing leaders, the stakes are high. You're being asked hard questions:
What's actually driving demand?
Why are we investing here?
How do we know it's working?
The frustrating truth? Most of what drives demand happens outside your platform's line of sight. But your customers know, and the smartest teams are starting to ask them directly.
Attribution surveys bring your buyer’s voice into your measurement stack. They capture insights that platforms can’t, and reveal patterns that help you act faster, and with more confidence, not just more data.
Measurement stack |
|---|
The collection of tools, platforms, and methods a company uses to monitor performance and guide marketing decisions. This typically includes analytics platforms, attribution models, surveys, business intelligence (BI) dashboards, and testing frameworks. |
When done well, they become a decision-making asset. They help you shape spend, refine creative, strengthen internal alignment, and improve marketing efficiency. That means maximizing return on spend, allocating budget with greater precision, and expanding the margin between investment and revenue.
But that's the real issue—how do you actually do attribution surveys well?
This guide will answer that question and show you:
Where your measurement stack falls short and how attribution surveys close the gap
What "good" looks like when it comes to survey timing, design, and implementation
How to translate raw responses into strategic clarity that your team will actually use
Let's start with the big picture: why attribution has become harder, what it's costing you, and how leading teams are adapting.
CHAPTER 1
The Attribution Gap and Why Your Stack Isn’t Enough Anymore
Marketing attribution has long been treated as a data problem. Solve the tracking and you solve the puzzle. But today’s attribution challenges run deeper than broken pixels or disappearing cookies. They’re rooted in a fundamental mismatch between how buyers behave and how most tools are designed to measure.
Why attribution is breaking
There are two main reasons attribution is breaking down.
The first is technical: privacy regulations, browser changes, and platform limits have closed the tracking loops that marketers once relied on.
Data that was once accessible, like cross-site behavior or third-party insights, is now blocked, incomplete, or entirely invisible. While platforms once promised clean, linear customer journeys, the idea of capturing a complete conversion path has never really reflected the reality of modern behavior, especially in a mobile-first, multi-device world.

01 WHERE ATTRIBUTION BREAKS DOWN.
The second is behavioral: customer journeys no longer unfold in places where your measurement stack is built to monitor. The last five years have brought a massive shift toward hard-to-measure (HTM) channels.
Hard-to-measure (HTM) channels |
|---|
Channels and discovery moments that don’t leave clean digital trails. Examples include podcast mentions, word-of-mouth, TV ads, community chatter, creator content, and group texts. |

02 The Modern Channels Driving Product Discovery.
People discover brands through podcast advertising or mentions, TV ads, influencer Reels, Slack communities, Discord chats, and Reddit threads. They hear about you on a morning run or in a group text.
Those early signals don’t get captured by last-click models, but they still shape intent.
Last-click models |
|---|
A type of attribution model that gives full credit to the final touchpoint before a conversion. While simple, it often undervalues earlier touchpoints that sparked initial intent. |
This dual breakdown—vanishing data and off-platform behavior—has widened the attribution gap, and most measurement stacks aren’t built to close it.
Attribution gap |
|---|
The blind spot between what marketers can track and what’s actually influencing buyer behavior. This gap has grown as privacy changes and off-platform discovery have made traditional tracking less reliable. |
When the data disappears, confidence goes with it
The result? Spend flows to what’s visible. Lower-funnel channels that show conversion get over-prioritized. Top- and mid-funnel plays get undervalued or ignored. And marketers end up flying blind at the exact moments when customers are forming intent.
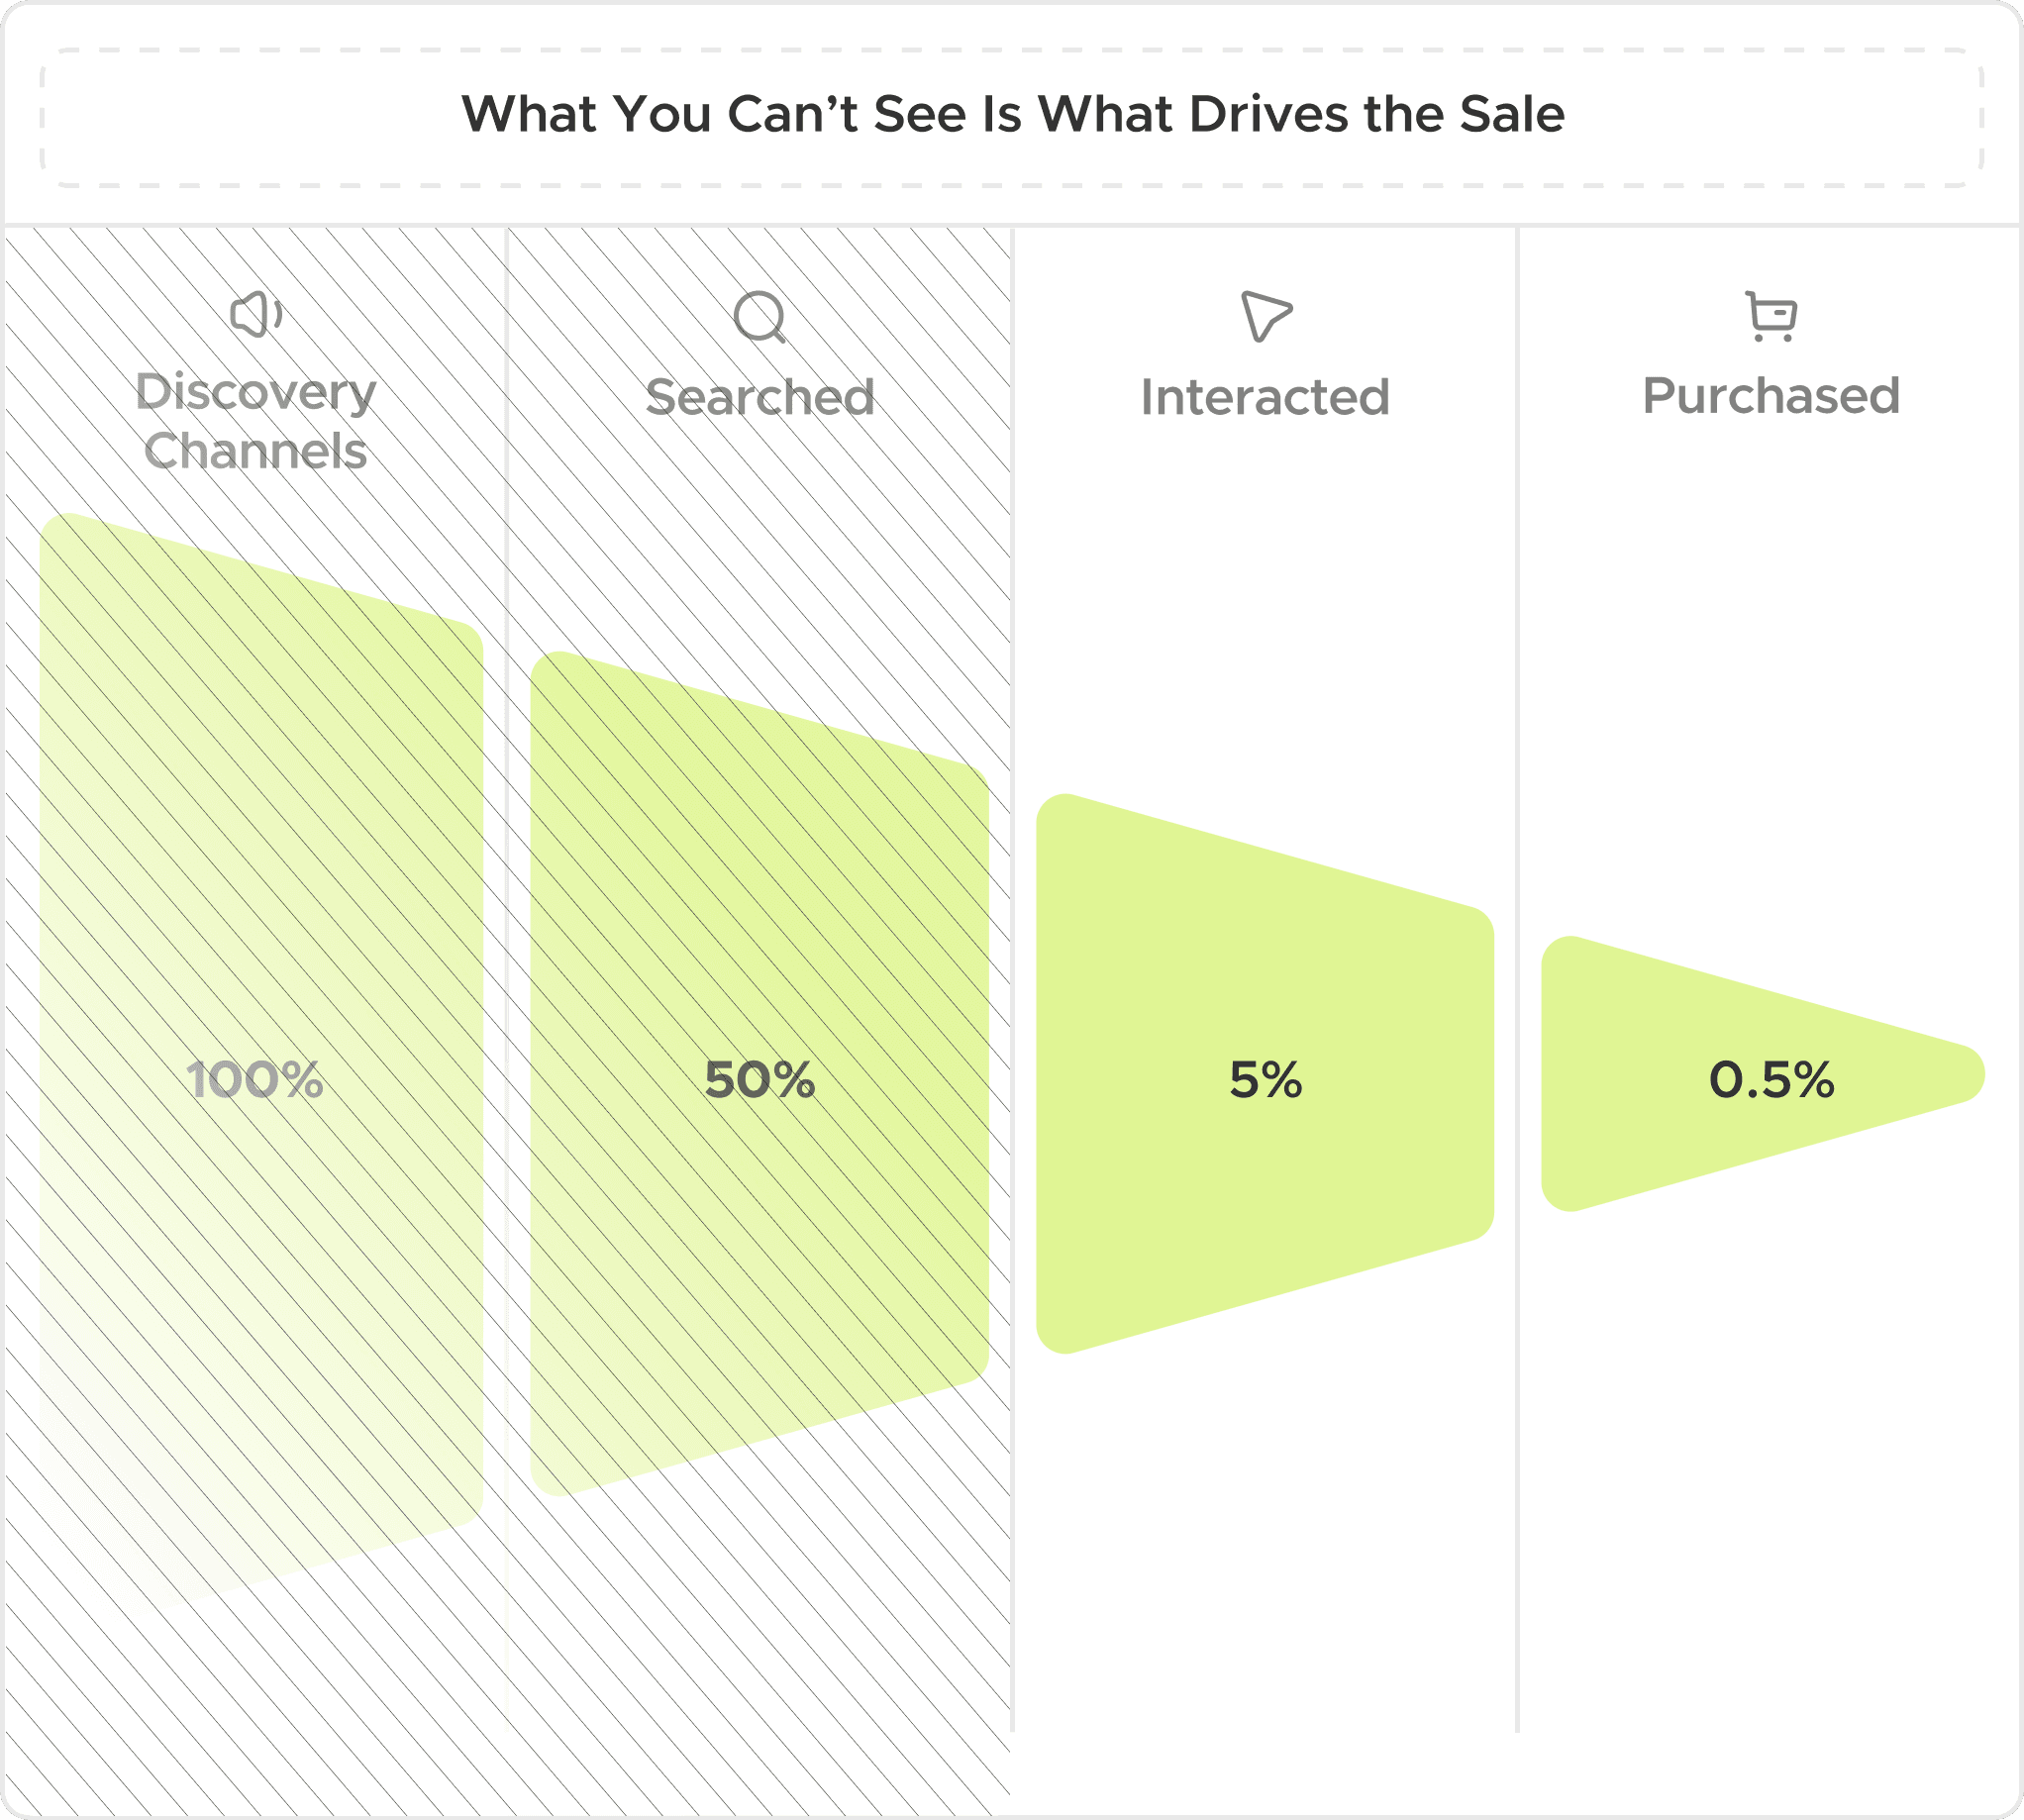
03 Discovery and research shape intent, but rarely show up in your reports.
Inside companies, this creates friction.
Measurement reports don’t match internal instincts. Teams feel something is working—maybe it’s a podcast run, a community partnership, or a TV ad—but can’t prove it with data. That disconnect makes every decision harder.
The question marketers must answer isn’t just, “How are we performing?” It becomes:
“Why does our reporting contradict what the team is sensing in the market?”
“Why do we keep investing in tactics that convert but don’t grow demand?”
“How are we supposed to defend this budget?”
Even the attribution methods that still function often don’t answer the right question. “What did they click?” isn’t the same as “What influenced them?”
Why remembering beats tracking
Platforms show a path, but people remember the moment they decided to click or make a purchase. That memory is the real signal, and it can only surface when you ask them.
That’s where attribution surveys come in. They don’t replace your measurement stack. They strengthen it by adding the one thing platform data can’t collect: context, straight from the source.
Attribution surveys |
|---|
A direct method of asking customers how they discovered your brand or what influenced their decision. Unlike platform-based tracking, these surveys surface customer-reported signals that traditional tools often miss. |
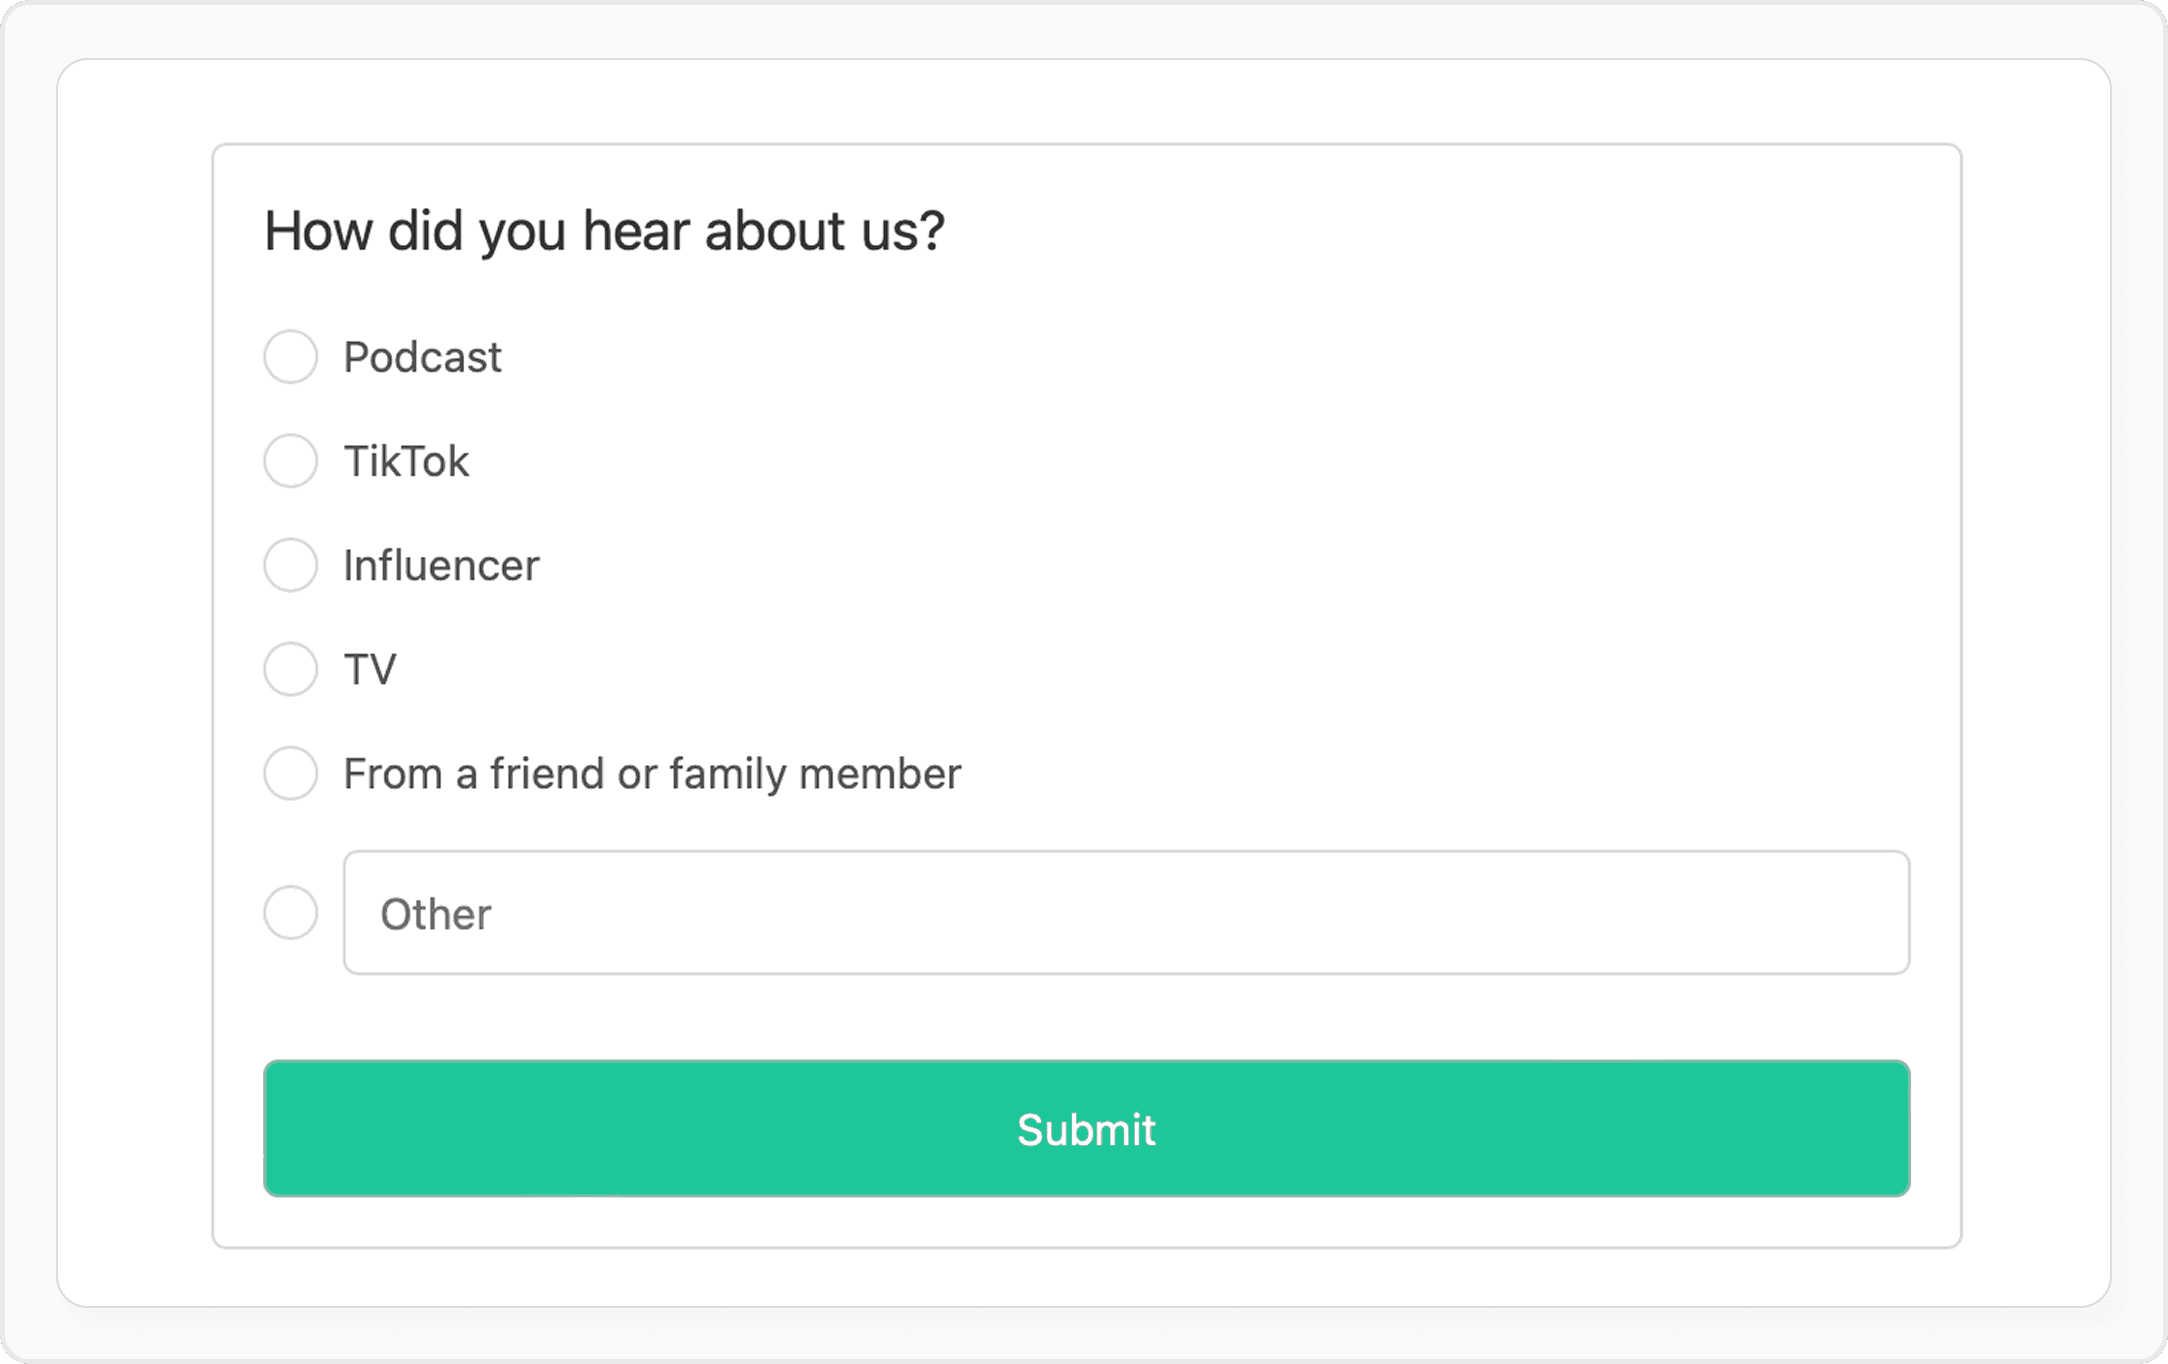
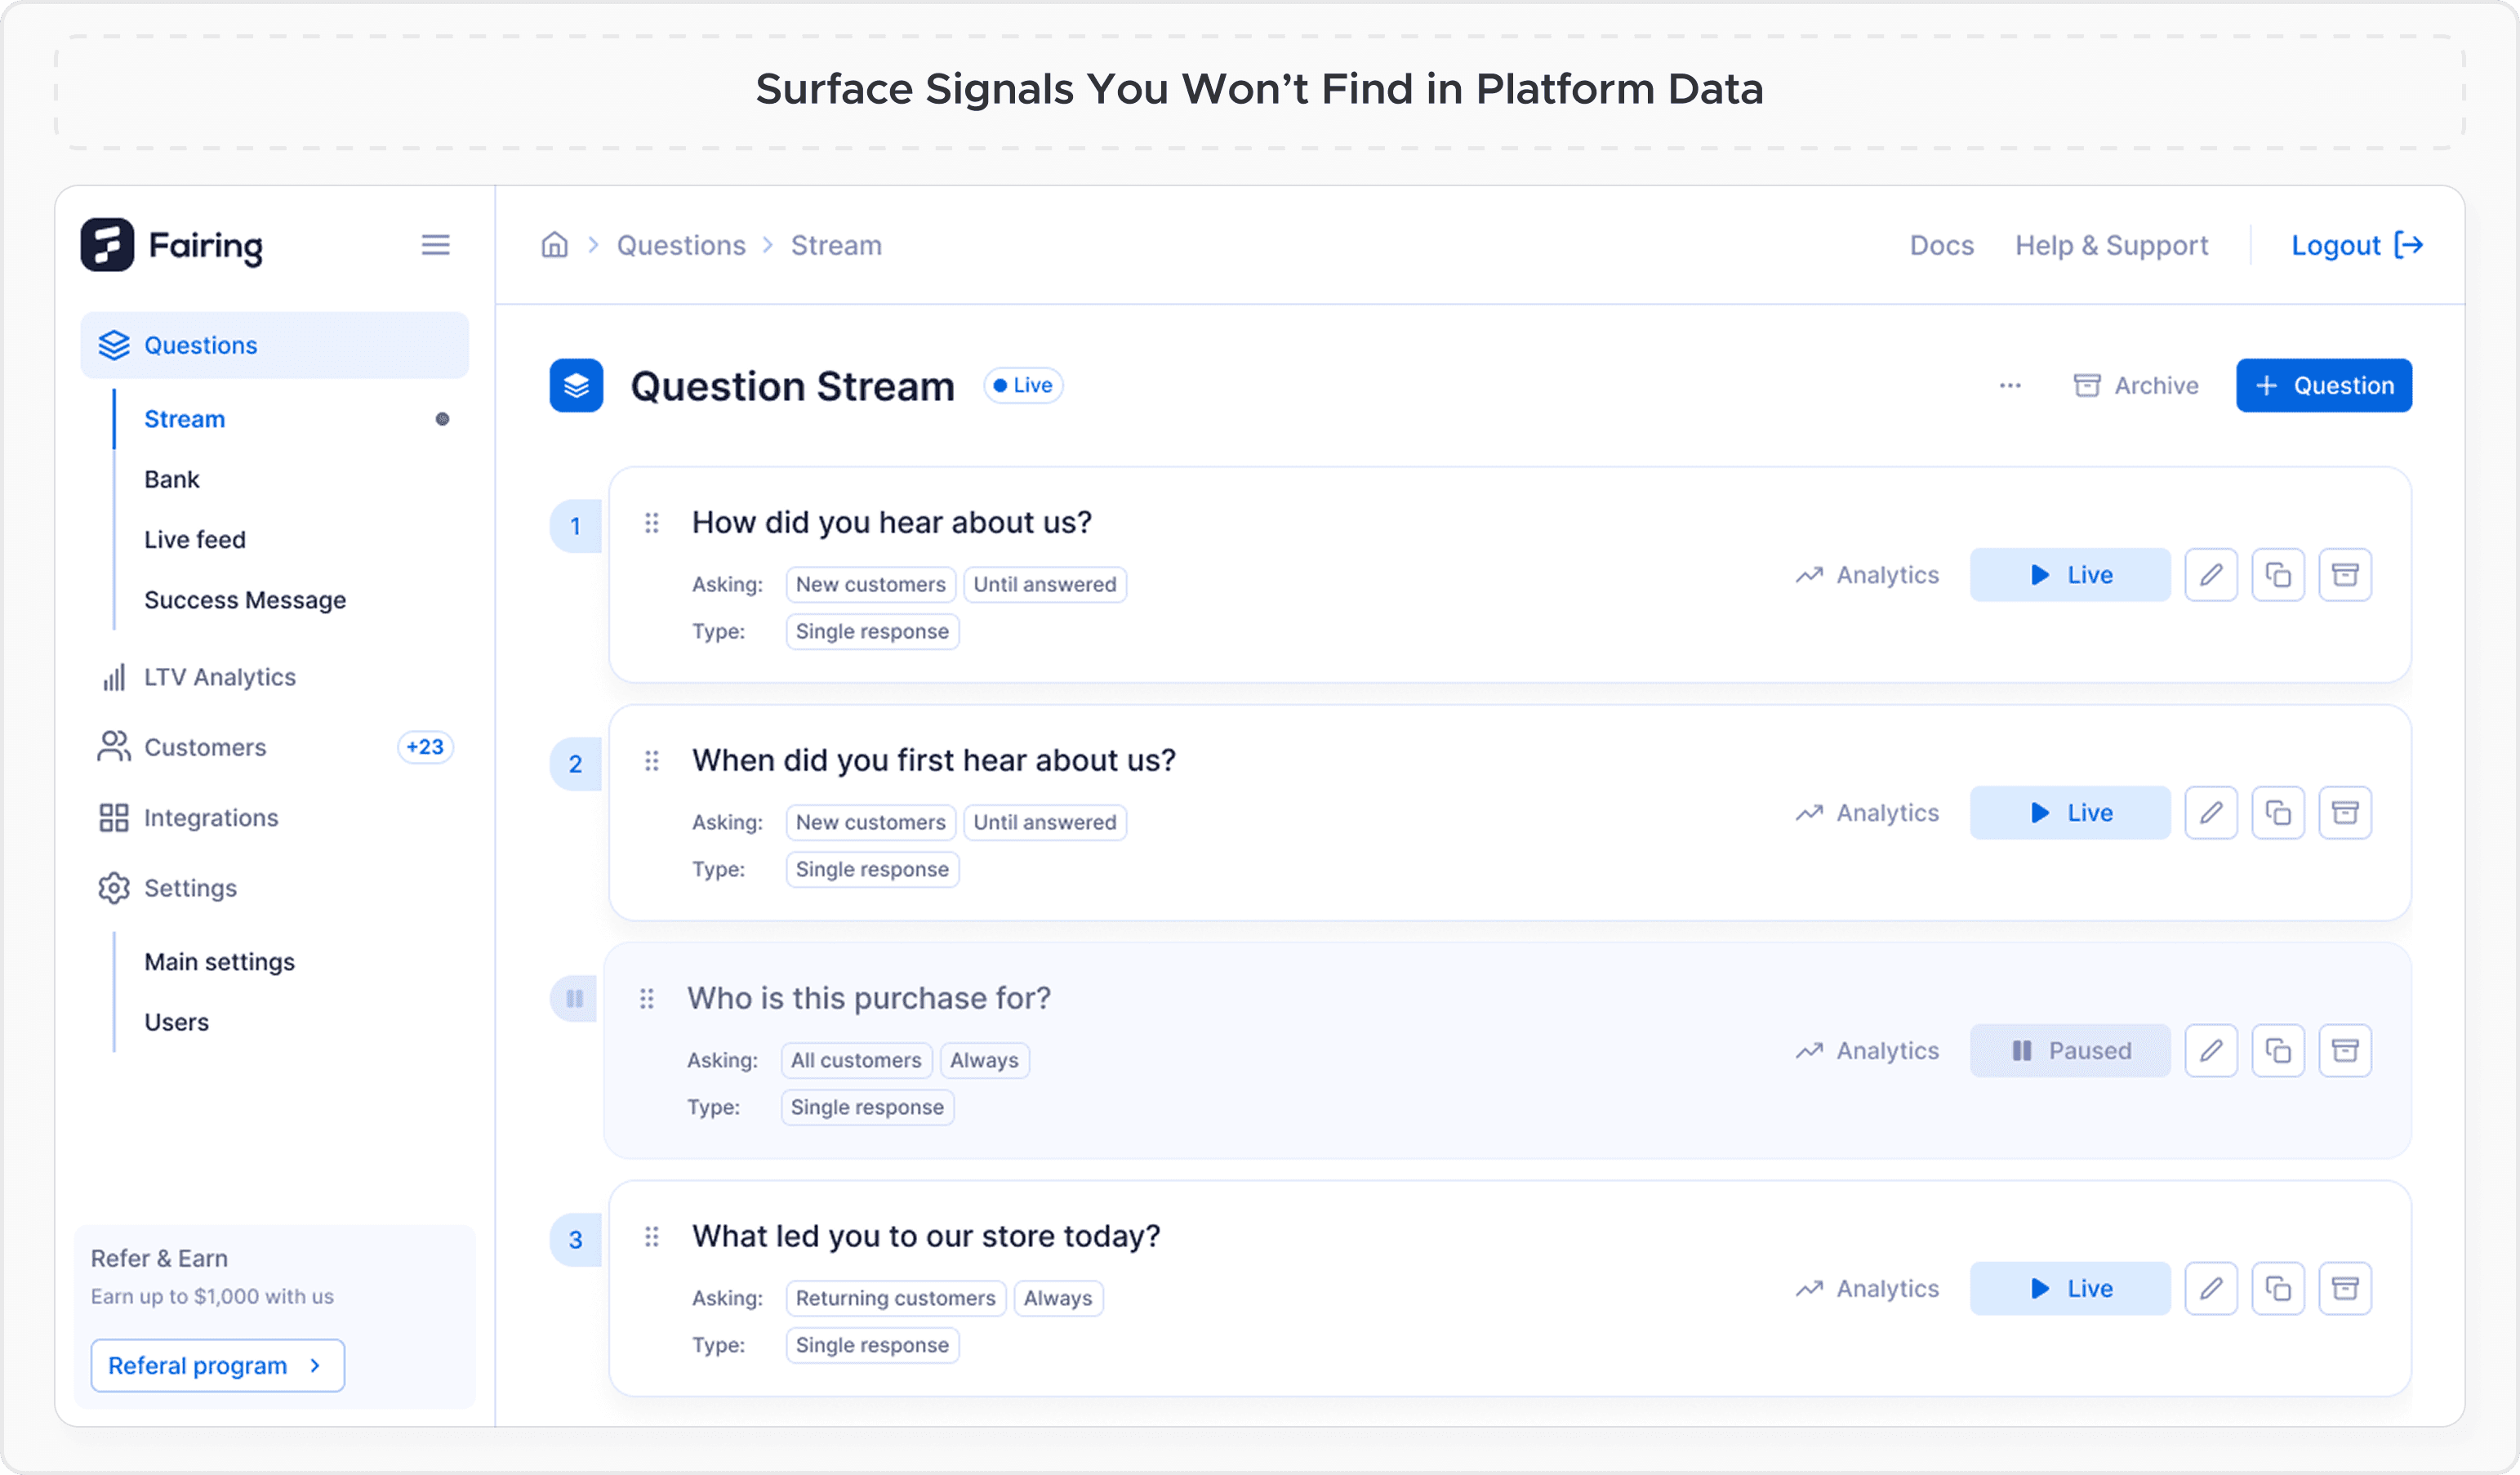
04 Attribution Survey Example.
Attribution surveys capture influence that dashboards can’t detect and that even sophisticated inference models, like incrementality tests or Marketing Mix Modeling (MMM), still have to approximate.
Marketing Mix Modeling (MMM) |
|---|
A statistical method that uses historical data to estimate the overall effectiveness of different marketing channels. It's often used for high-level budget allocation, but does not capture user-level influence. |
These surveys help teams see what’s actually driving demand, not just what’s trackable. And they give marketing leaders the clarity and confidence to prioritize what’s working, cut what’s not, and communicate impact with greater precision.

What traditional attribution misses |
|---|
The reality:
|
The cost:
|
The shift:
|
Read on to see how attribution surveys work, where they shine, and how they fit into your broader measurement strategy.
CHAPTER 2
Why Direct-From-Consumer Attribution Is Your Strategic Advantage
Once you see the attribution gap clearly, the next question becomes, “How do we close this gap?”
Attribution surveys aren’t just a DIY workaround or lightweight tactic. They’re a modern measurement layer built to surface the insights your stack can’t access.
In some cases, they even outperform more complex models, offering faster, more transparent, and more cost-effective visibility into buyer behavior.
Whether you use them alongside other tools or as a replacement for heavier approaches, they bring a unique and increasingly essential perspective to your measurement mix.
Rather than relying on inference, surveys go straight to the source: your customer. They ask what influenced someone to take action and illuminate patterns you can’t find in a dashboard.
This matters more than ever. Most demand creation happens off-platform in places pixels can’t track. Think podcast mentions, TV segments, creator shoutouts, and Slack threads. Those moments shape intent. Attribution surveys help you capture them.
Why customer memory is the real signal
Unlike pixels or algorithms, surveys don’t require perfect paths or complete datasets to be useful. They rely on something far more powerful: memory.
What customers remember is what mattered to them, and those memories tell you a lot:
A friend’s text that sparked the first search
A podcast that made your brand feel credible
A community recommendation that pushed them to convert
Surveys transform those recollections into structured data. When you standardize how you ask and analyze, you get meaningful, consistent signal, even across the messy, nonlinear journeys modern buyers take.
What memory reveals isn’t just anecdotal. It’s the context that helps marketers shape strategy, not just react to reports.
Where attribution surveys outperform other methods
Attribution surveys shine in precisely the places your existing tools fall short:
Your branded search traffic is climbing, but nothing clearly explains why
You just launched a podcast campaign and buzz is building, but you can’t prove impact
Word-of-mouth and connected TV are working, but nobody can say precisely where or how
These aren’t edge cases. They’re increasingly the norm. Attribution surveys bring structure to that noise. They let you validate instinct, uncover blind spots, and steer strategy with clearer inputs.
You don’t need thousands of responses or a year of data to find value, either. A steady flow of clean, buyer-reported answers can help you spot trends, prioritize the best channels, and build internal alignment faster.

Podcast attribution is broken. This tool fixes it.
Promo codes and vanity URLs miss most of your conversions.
This free calculator helps you uncover the real ROI of your podcast ad spend using a simple, proven multiplier method based on post-purchase survey data.
What you gain when you ask
Used well, attribution surveys become a shared source of truth. They ground your team in your customer’s experience, and they:
Help marketing identify and scale high-intent channels that don’t show up in dashboards
Help growth reallocate budget based on undercredited influence
Help leadership connect the dots between brand investments and business outcomes
No measurement method solves everything, but surveys solve the one thing your stack can’t: the context behind why someone showed up.
When you understand that, you can start using attribution surveys not just to uncover truth, but to build a strategy around how you use them.
Asking is only part of the equation, though. The real advantage comes from how and when you ask, as well as how you turn what people say into insights your team can trust.

What attribution surveys reveal |
|---|
|
Read on to learn the strategic but straightforward foundations of building an attribution survey program that drives clarity, action, and real marketing impact.
CHAPTER 3
How to Build a High-Signal Attribution Survey Program
Once you understand what attribution surveys can reveal, the next step is making sure you get the signal you’re looking for.
That starts with building a program designed for quality, not just volume.
Too many teams view surveys as a one-and-done tactic: toss a question into an onboarding sequence or a post-purchase flow and hope for valuable insights.
But a high-signal program requires intention: smart timing, strong internal alignment, thoughtful phrasing, and an understanding of how bias can quietly skew the data.
Done right, attribution surveys become the source of truth in your measurement mix—one that’s easy to scale, simple to operationalize, and valuable across functions.
Let’s look at how to set that foundation.
Lay the groundwork for quality
Before you think about tools or templates, you need the right conditions for signals to emerge. These four principles will help you design a survey experience that’s not just easy to launch, but built for trust, adoption, and decision-making across teams.
1. Start with smart placement, not just good intentions
Attribution surveys work best when you ask the right people, at the right time, in the right context, and that context should be as close to the transaction or moment of decision as possible.
That’s why in-the-moment placement, like post-purchase or during onboarding, drives the strongest results.

Here are a few common examples:
Post-purchase or conversion → captures decision-making while it’s still fresh
In-app or onboarding → works well for mobile apps, SaaS, or subscription flows where activation matters
Email/SMS follow-up → carries a significant risk of recency bias and isn’t recommended, especially when delayed more than 24 hours after conversion.
Recency bias |
|---|
A type of response bias in which customers are more likely to recall and report the most recent touchpoint they experienced, rather than the one that influenced them first. |
Asking at the right moment also helps reduce bias. The further from the conversion you get, the more likely a customer is to recall the last thing they saw, not what truly influenced them.
2. Keep friction low and context high
Even the best question falls flat if the experience is clunky.
Design for real-life conditions: mobile screens, fast-loading experiences, and short attention spans. Respect your customer’s time by keeping the survey short, clear, and conversational.
A simple “How did you hear about us?” often surfaces high-value insights, especially for first-time buyers or users. For returning users or legacy brands, a question like “What led you to purchase today?” can uncover longer consideration cycles or repeat intent.
You’re not just designing for the user. You’re planning for internal adoption, too. When survey responses feel credible and complete, it’s easier to get stakeholders to trust and use the data.
3. Watch for recency bias and plan around it
Recency bias is one of the biggest threats to attribution data quality. Ask too long after the decision, and you risk getting skewed answers that reflect only the last thing a customer remembers.
For most brands, the best window to ask is close to the point of transaction. But even then, phrasing matters.

Bias is inevitable, but smart timing and phrasing help minimize its effect and ensure the answers reflect real influence, not just recent touchpoints.
4. Build trust before you expect insight
Internally, survey data only becomes useful when it’s trusted. That means alignment matters. Make sure key stakeholders understand what you’re asking, how you’re collecting that data, and where it fits into your larger measurement strategy.
Clarity upfront saves second-guessing later. If stakeholders dismiss your survey data as vague or unreliable, it won’t influence decisions, no matter how strong the signal.
This is also where having a partner like Fairing, who’s seen what works across hundreds of implementations, can help you avoid common missteps before they happen.
Even the best-placed survey, though, won’t deliver value if the question itself falls flat. To get meaningful responses—the kind that guide strategy and drive confident decisions—you need to ask in the right way, which we’ll cover next.

What strong survey placement looks like |
|---|
|
Ask better questions, get better signal
A well-placed survey won’t get you far if the question falls flat.
Too often, attribution surveys get reduced to a throwaway form field: a vague “How did you hear about us?” followed by a wall of options no one reads.
The result? Unclear signal, unhelpful answers, and internal skepticism about whether surveys work at all.
But the problem usually isn’t the format. It’s the phrasing, the structure, and the lack of intentional follow-up.
To get high-quality responses that drive decision-making, you need to ask better questions. Here’s how.
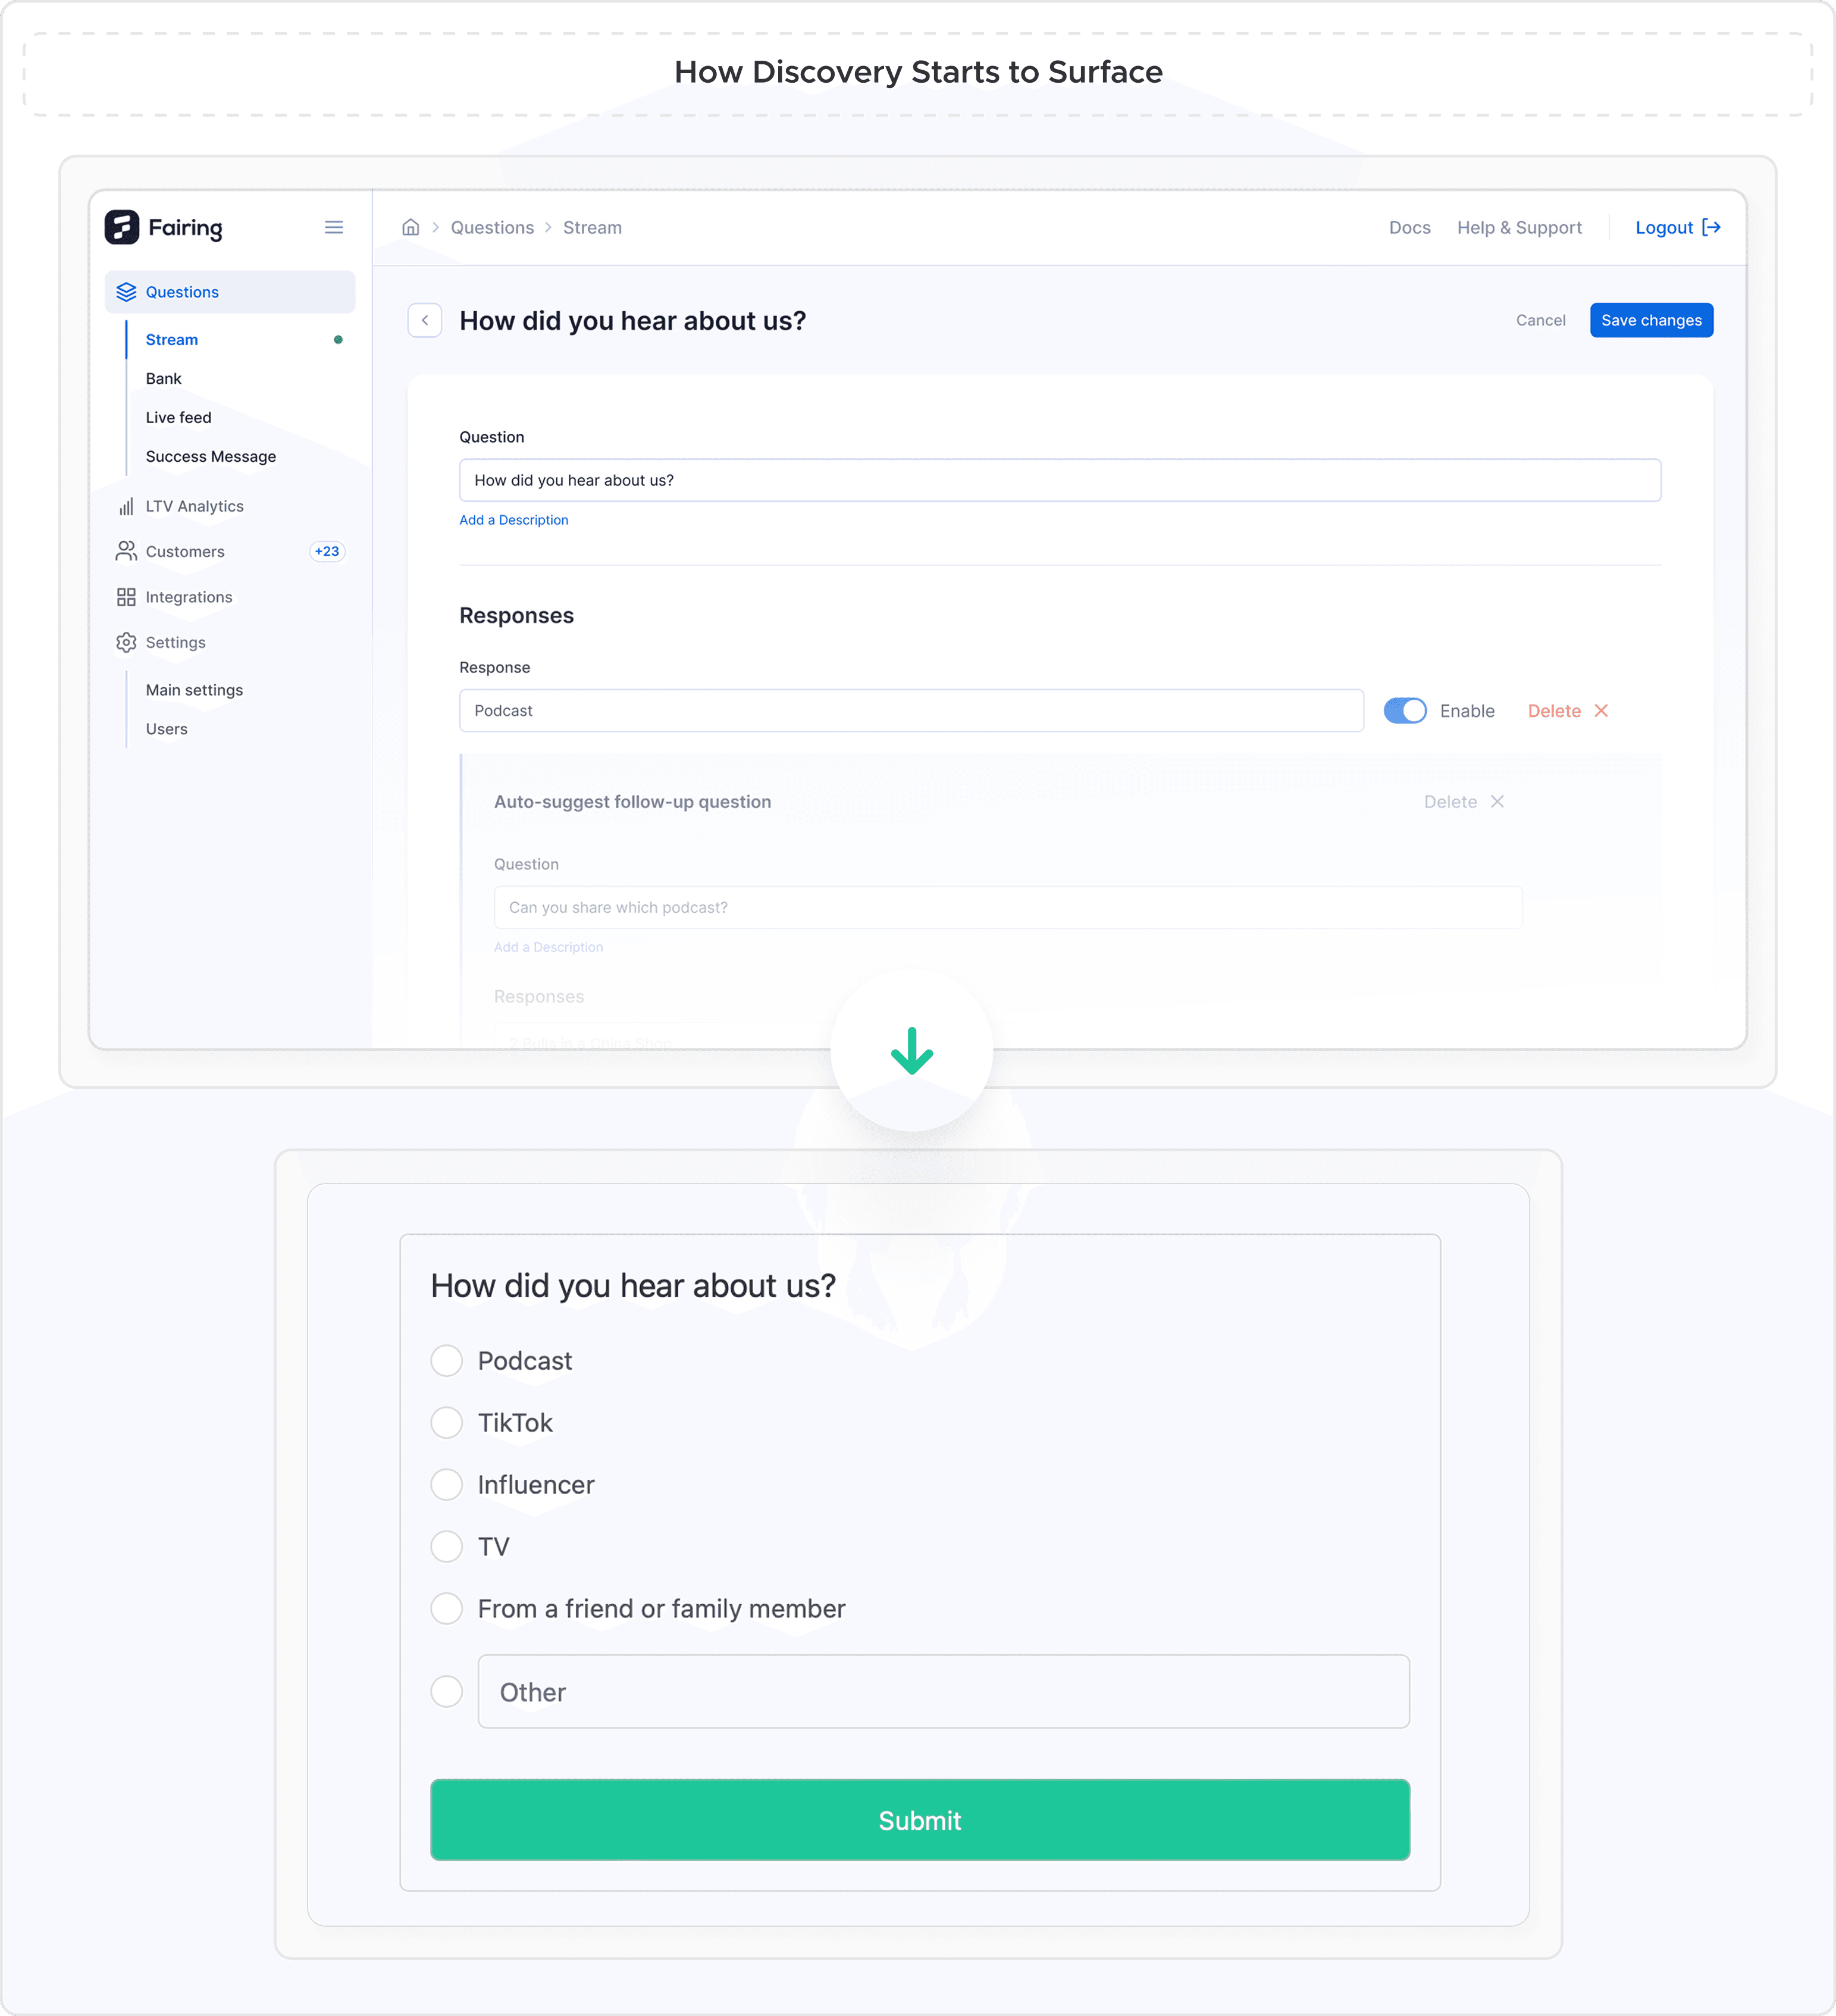
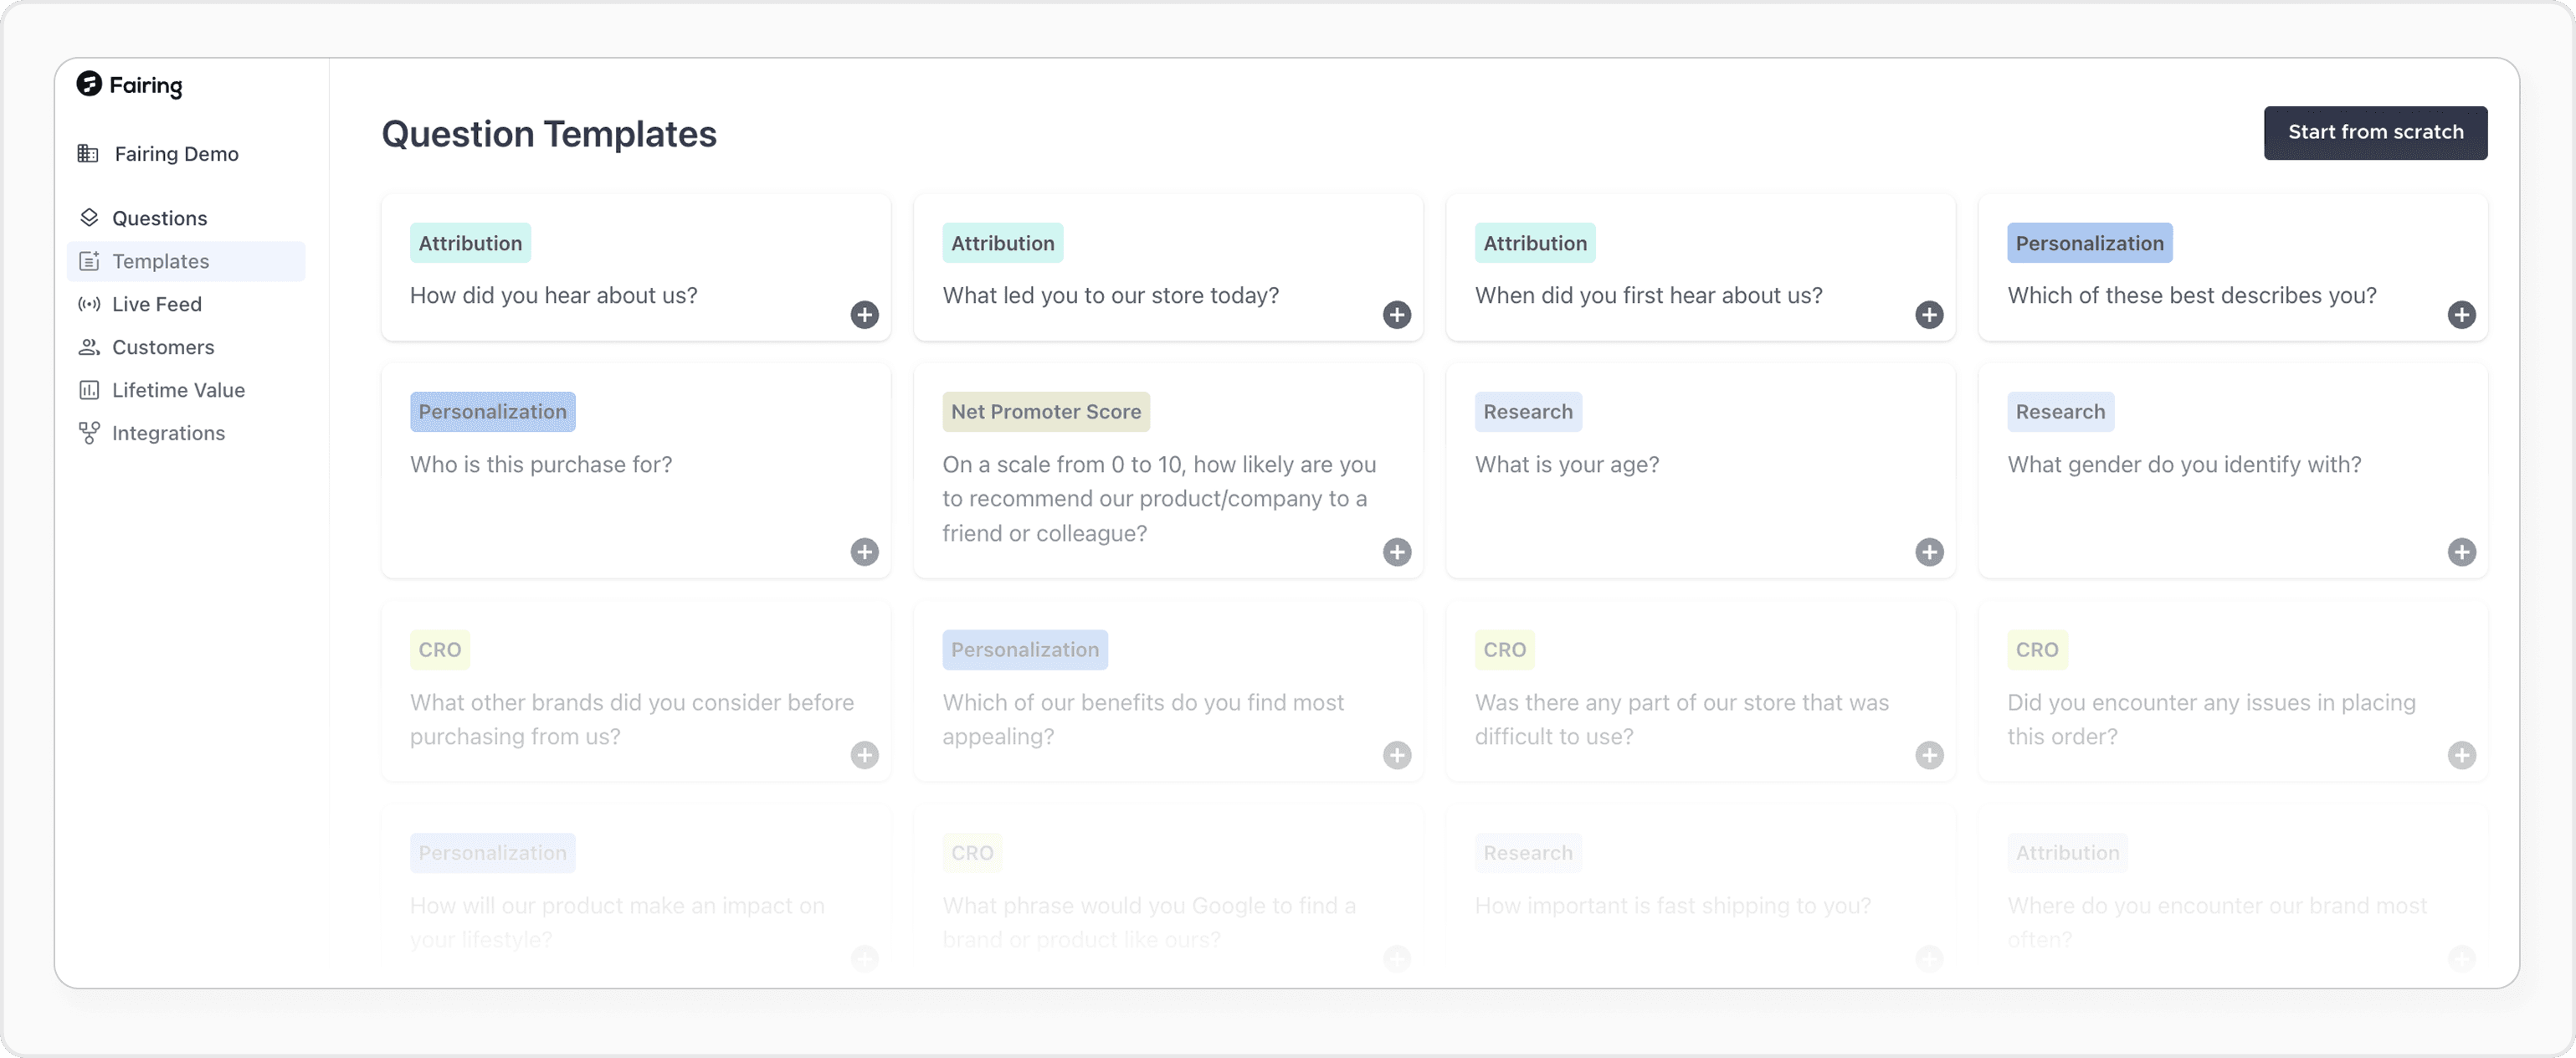
1. Don’t just ask—guide
Most survey programs start with a HDYHAU (“How did you hear about us?”) question, and for good reason: it surfaces direct-from-customer context while keeping friction low.
HDYHAU |
|---|
Short for “How did you hear about us?” This common survey question captures the first moment of brand awareness directly from the buyer. |
But asking the question well is just as important as asking it at all.
Instead of a vague, open-ended prompt or a multi-select menu that muddles the data, ask for the primary source.
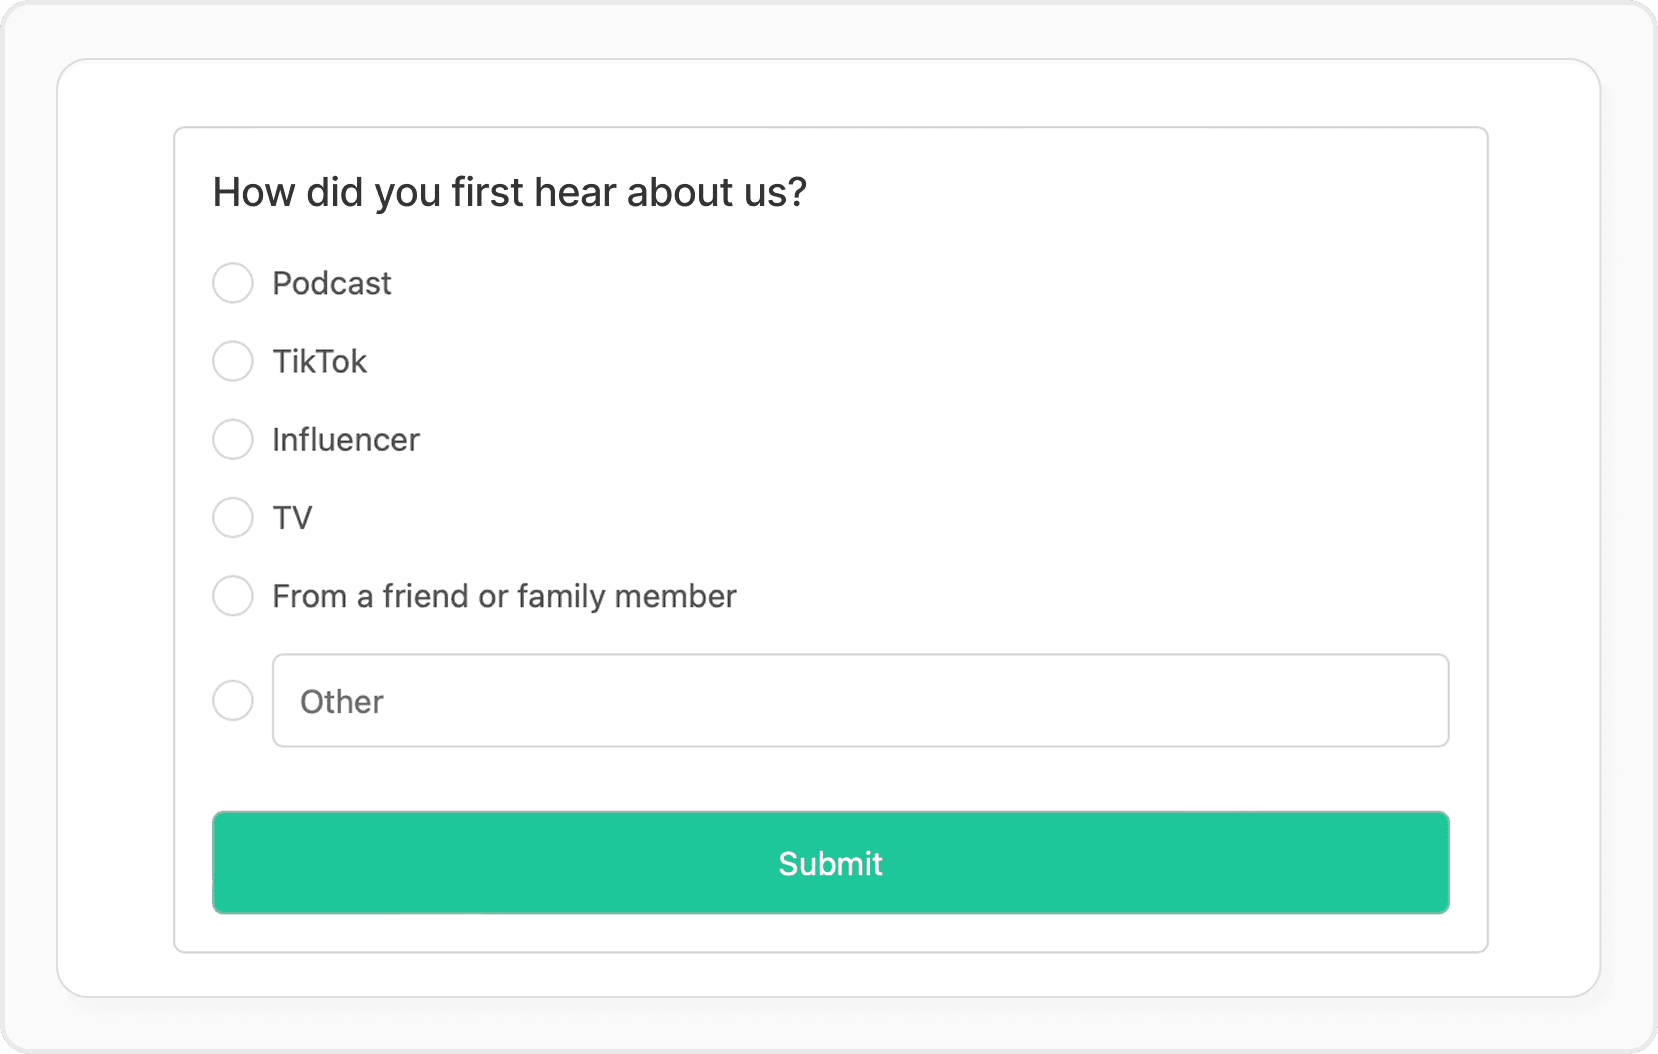
05 Attribution Survey Example.
This single tweak does two critical things:
It forces prioritization and helps you separate signal from noise
It produces more precise data, faster, without requiring a full essay from your customer
People usually remember the moment they made a decision, not everything they saw along the way. That’s the insight you want.
2. Follow the memory
Layer in behavioral follow-ups to capture context around that moment of influence. These questions go beyond attribution and help you map buyer psychology and journey dynamics:
“What led you to buy today?” → surfaces lower-funnel nudges
“When did you first hear about us?” → reveals the discovery-to-decision timeline
“Where else did you see or hear about us?” → clarifies channel type for top-level mentions
Together, these answers help you understand why something worked, not just what they clicked.
3. Avoid the common traps
It’s easy to sabotage your survey without realizing it. A few things to watch for:
Option overload: Long lists create decision fatigue and bump people to “Other”
Unclear labels: “Instagram” could mean paid, organic, or influencer. Top-level choices are fine, but use follow-ups to clarify
Overlapping options: Avoid forcing people to guess which bucket their experience falls into
Overengineering: While traditional long surveys kill completion rates, platforms like Fairing progressively capture responses so you can still gather depth without friction
The goal isn’t perfection—it’s clarity.
4. Write like a human
You’re not surveying robots. Use language your audience uses.
“How did you hear about us?” consistently outperforms options like “Please select your initial point of brand exposure.”
A conversational tone builds trust, keeps completion high, and makes the insights more compelling when shared internally.

How to ask for more precise answers |
|---|
|
Most attribution tools miss the mark. These survey questions don’t.
Get our top-performing post-purchase survey questions, plus the multiplier method that leading brands use to uncover the real impact of their cross-channel campaigns.
Make your data usable, or it won’t get used
Getting attribution survey responses is only the first step. The real value comes from what you do with them.
For many teams, survey data lives in isolation, scattered in Typeform exports or buried in a spreadsheet. But when handled intentionally, that data becomes a high-leverage input for the decisions that matter most. The key? Treat every response as a starting point, not a final answer.
Collecting attribution data is one thing. Turning it into something your business can act on is another.
To get there, you need a process that makes survey responses clean, trusted, and ready for use. That means translating vague answers into structured data, aligning your taxonomy with how people naturally communicate, and integrating the insights into the systems where decisions happen.
These three steps outline how to operationalize your survey data in a way that drives consistent, cross-functional value.
1. Don’t take answers at face value
When someone says “Instagram,” what do they mean? Was it a paid ad? A reel from a creator?
A DM from a friend?
Consumers tend to think platform-first. So rather than forcing them into a predefined box, strong survey design gives them the flexibility to respond with what’s most top-of-mind, whether that’s a
platform, a specific creator, or a podcast title. That flexibility improves data quality and reflects how people naturally recall influence.
Innovative teams don’t stop at raw input. They apply downstream reclassification to ensure each response maps to a usable, internal category without losing its original meaning.
Downstream reclassification |
|---|
The process of translating raw survey responses, especially open text, into structured, standardized categories that align with your attribution taxonomy. This ensures insights are usable across teams and systems. |
This process typically involves:
Reviewing open-text responses for recurring terms
Mapping ambiguous entries (e.g., “TikTok creator”) to internal taxonomy (e.g., TikTok vs. organic vs. influencer)
Creating logic that automatically assigns responses to structured labels for reporting
Think of this as turning customer language into company language without losing meaning along the way.
2. Align your taxonomy with how people talk and how your organization analyzes
Your attribution taxonomy sits at the intersection of two worlds: how your customers describe influence, and how your internal teams analyze and act on that data.
Attribution taxonomy |
|---|
An internal classification system that organizes attribution responses into structured categories (for example, Paid Social, Influencer, Organic Search) so you can analyze and effectively act on insights consistently. |
We recommend a flexible structure, often a paired format, such as Instagram → Instagram Ad or Podcast → The Diary of a CEO. This preserves the original signal while making it easier to integrate into reporting systems.
Reclassification isn’t just cleanup. It’s strategic translation. A few best practices:
Allow for open-text specificity in follow-ups when applicable
Refine your categories over time to reflect emerging trends or channel shifts
Align reclassification logic with your measurement dashboards, reports, and CRM fields
When your taxonomy evolves in tandem with customer behavior and internal needs, your survey program stays relevant and respected.
3. Make attribution data part of your operating system
Survey responses shouldn’t live in a silo. Once they’re cleaned and categorized, they need to flow into the tools your team already uses.
That often means pushing structured data into:
Measurement dashboards (e.g., Looker, BigQuery)
Shared databases (e.g., BigQuery, Redshift, Google Sheets)
CRM systems (e.g., Klaviyo, HubSpot, Braze, Iterable)
Other internal measurement tools
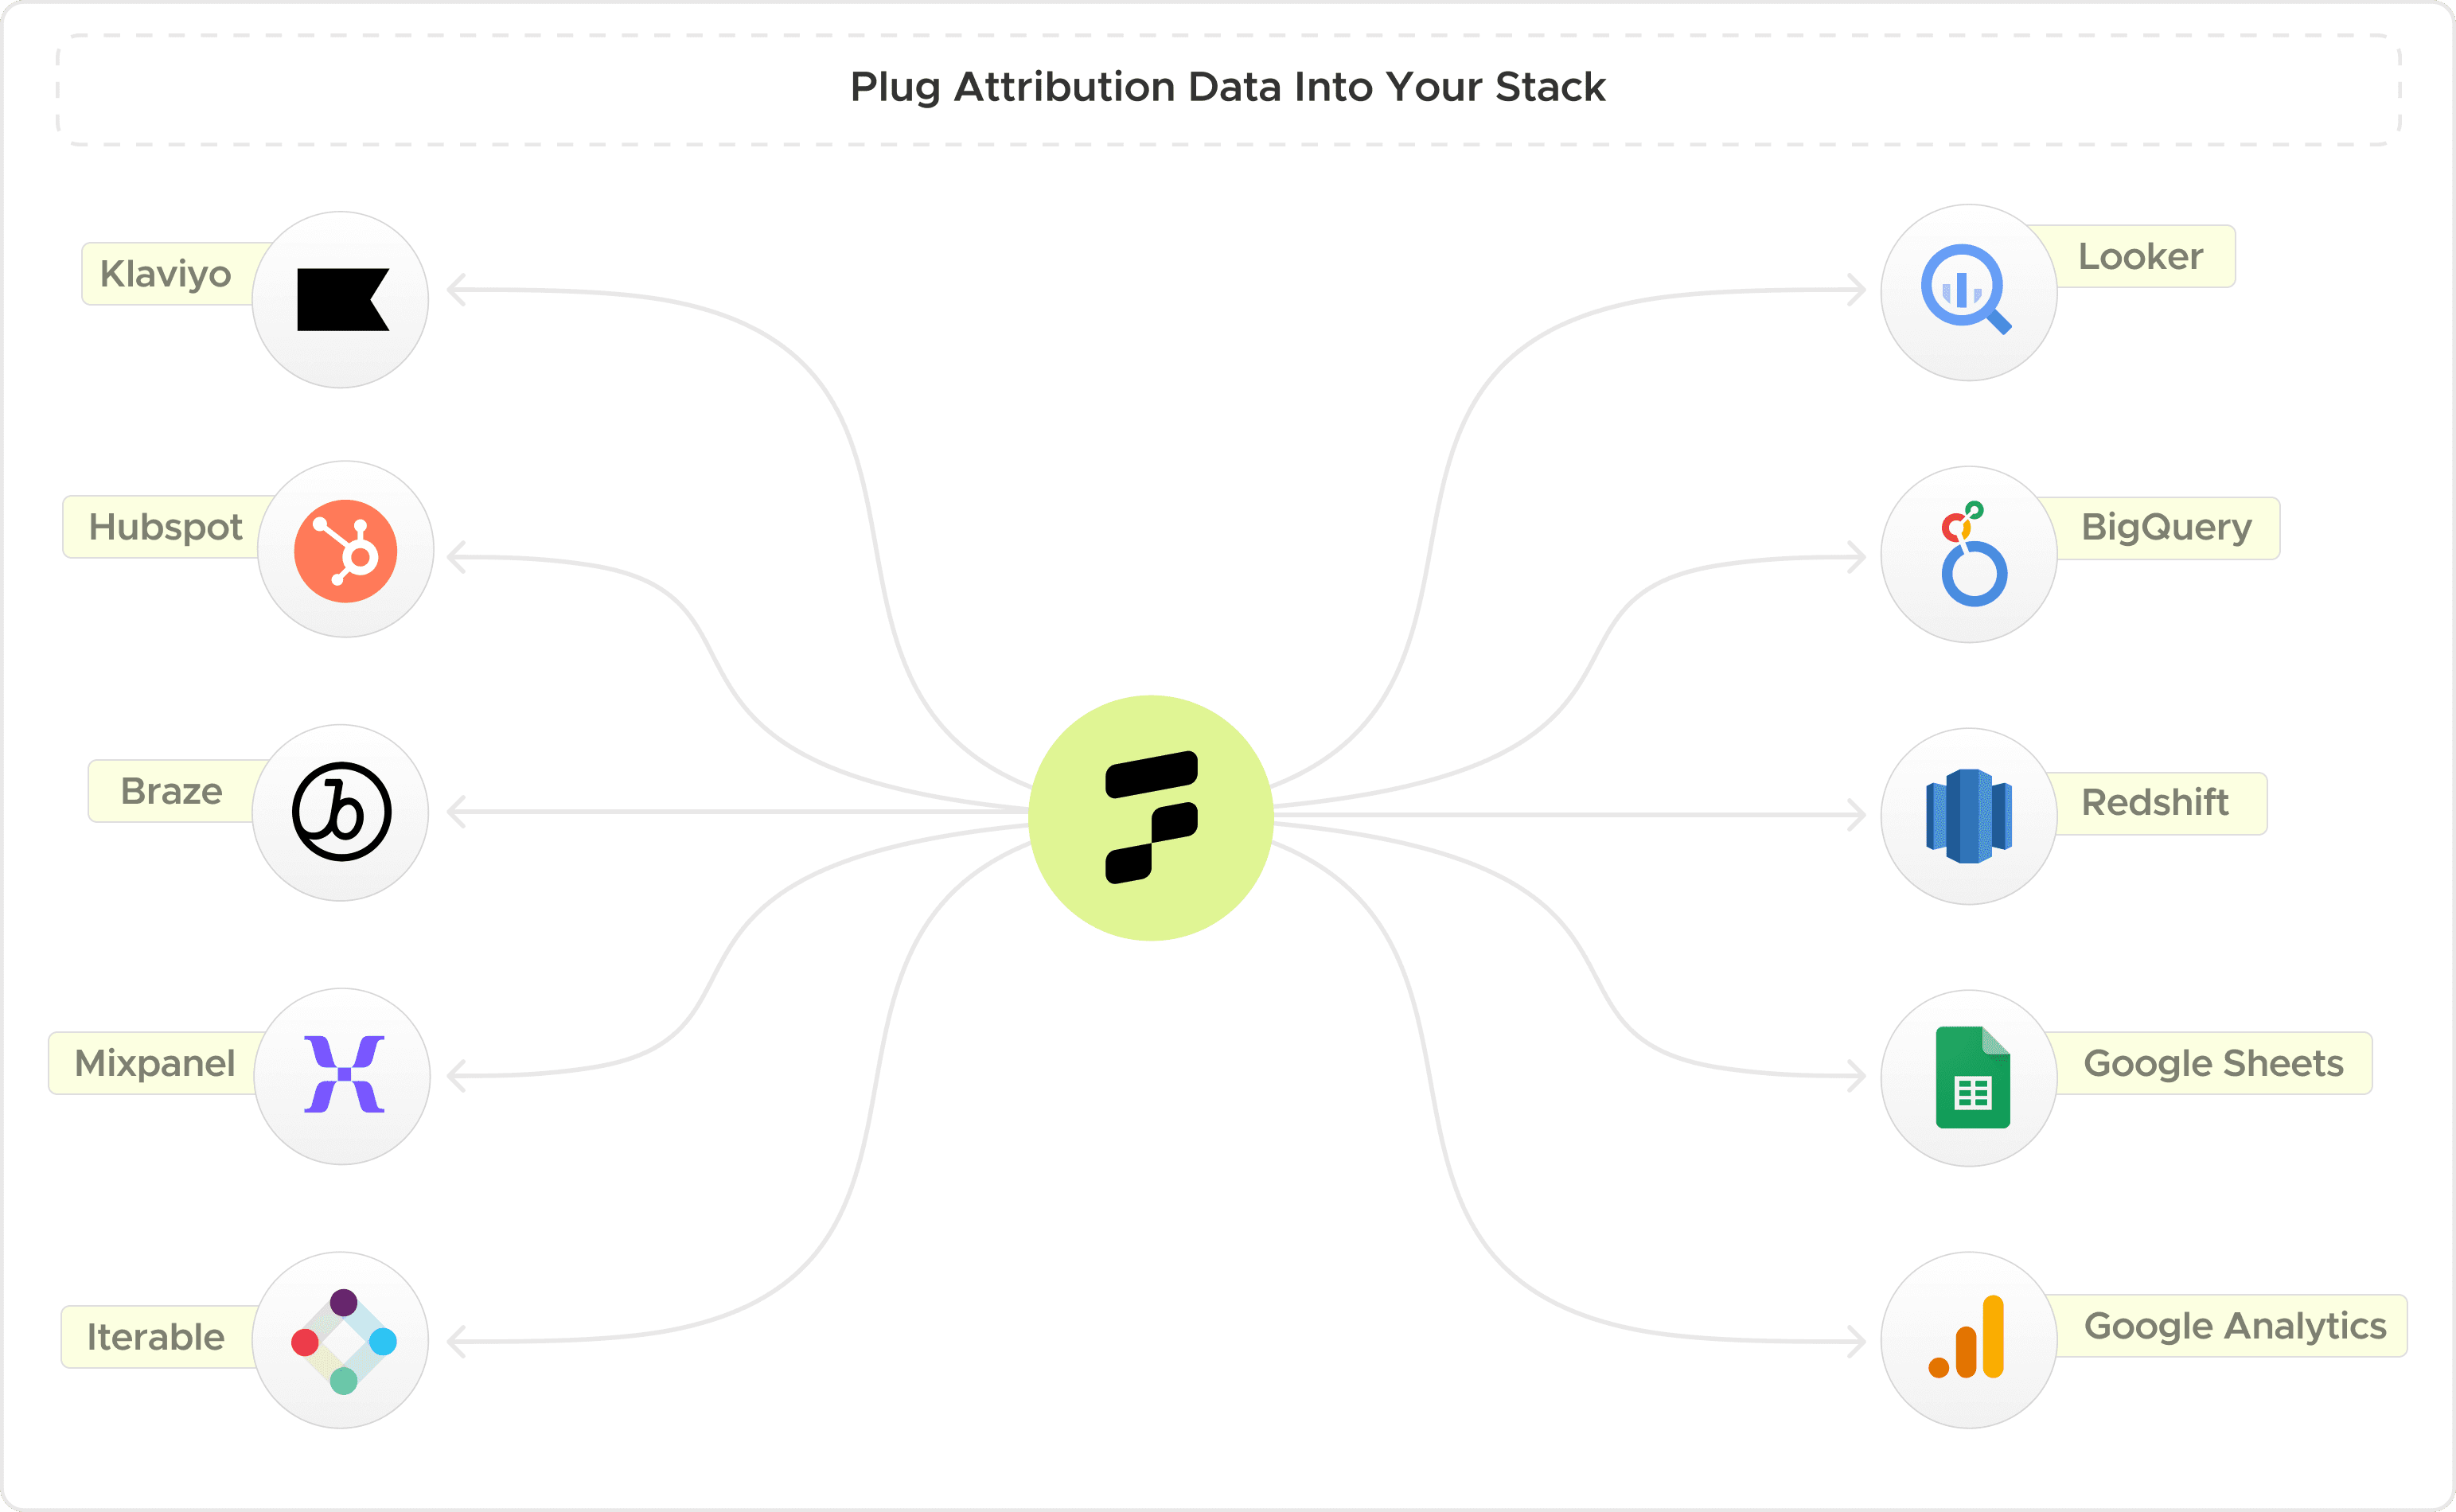
Integrating attribution data into these systems makes it visible, reliable, and ready for action, whether you’re reallocating budget, updating creative, or preparing for a board meeting.
When attribution becomes part of your operating system, it shifts from “nice to know” to “must-have insight.” That’s what makes it truly actionable.

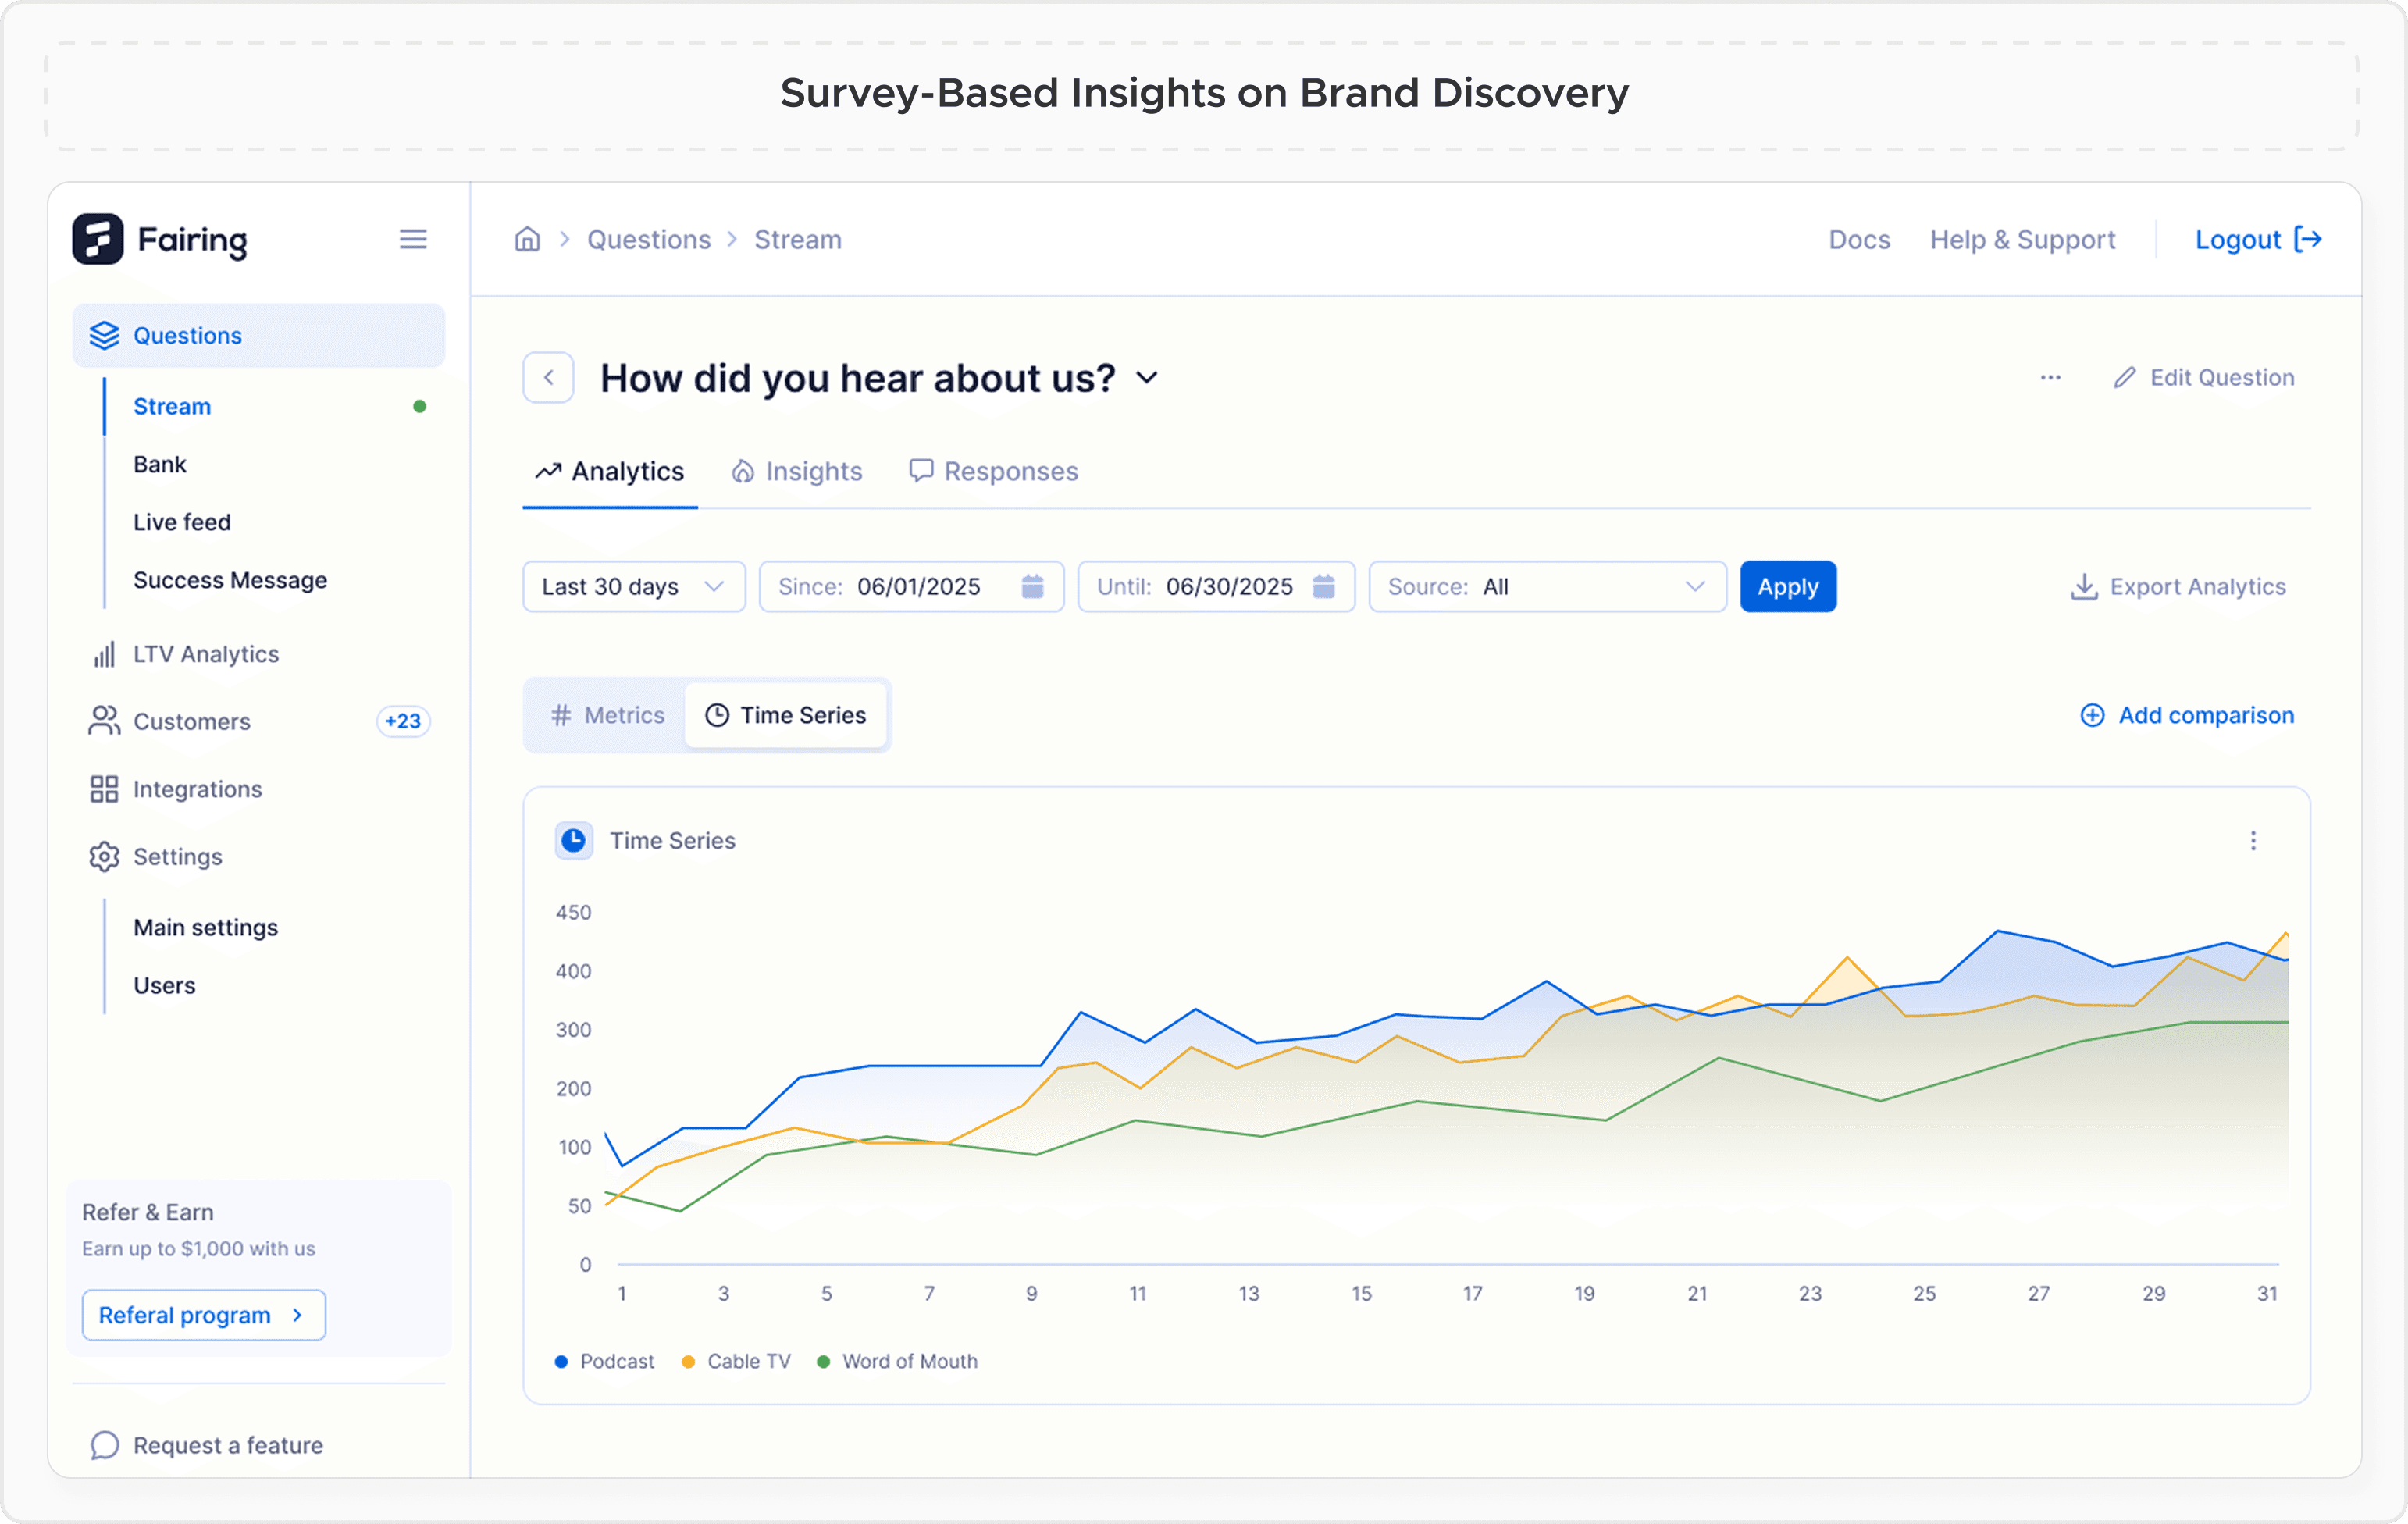
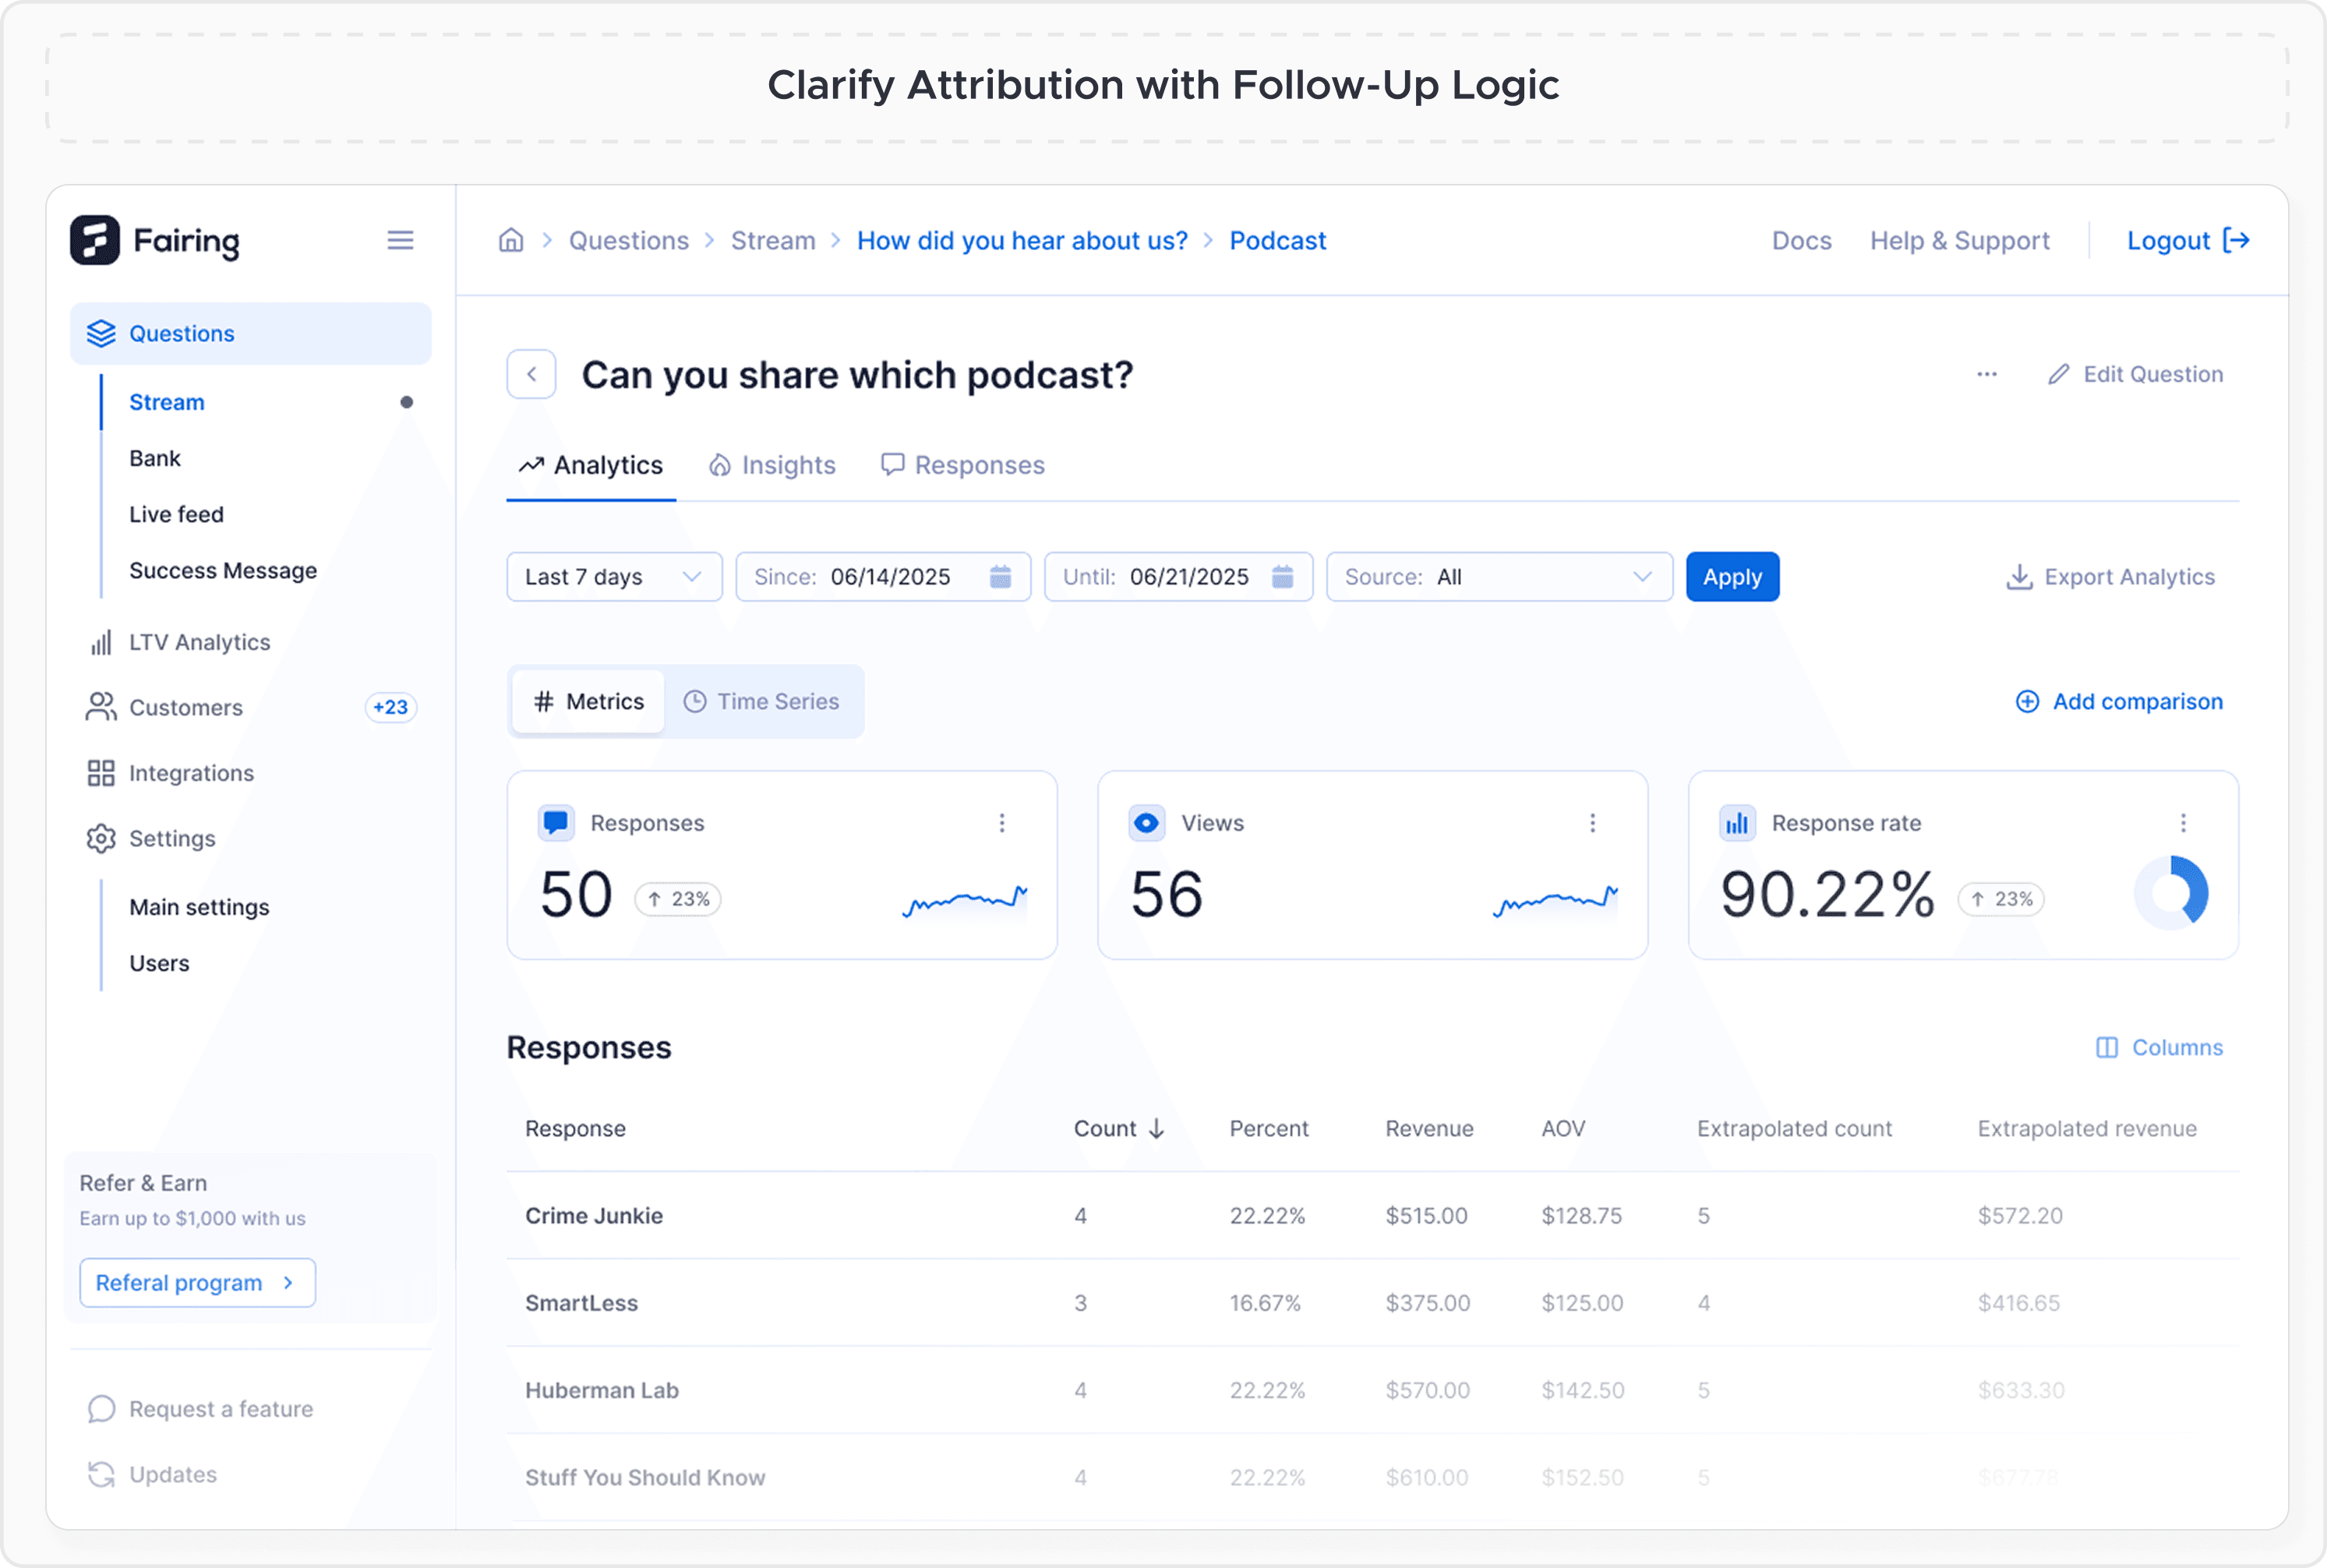
06 How Survey Responses Become Strategic Signals
How to operationalize your survey data |
|---|
|
From survey responses to strategic leverage
The best attribution survey programs do more than gather responses—they create leverage. When timing, design, and integration are done right, the result is insight your team can trust and act on.
With that foundation in place, it’s time to translate signal into strategy. Read on to see how high-performing teams turn attribution data into better spend allocation decisions, stronger creative, and measurable growth.
What high-signal survey programs do well |
|---|
|
CHAPTER 4
How to Turn Attribution Insights Into Strategic Action
Attribution surveys don’t just reveal where customers come from. They reveal what moved them to act. But insight alone isn’t enough. What separates high-performing teams is what they do next.
Once the survey responses are in, your job shifts from collection to conversion: using that insight to sharpen spend, guide creative, and inform smarter strategic bets.
Here’s how leading teams make attribution data drive real results.
Find the gaps your measurement dashboards can’t explain
Say your branded search volume is up, but there’s no clear source. No campaign spike, no PR push, no trackable signals from podcasts, TV, or out-of-home placements.
If you’re only looking at platform data, you’re stuck.
But attribution surveys might show something dashboards can’t: customers referencing a podcast mention, an influencer shoutout, or a conversation in a niche Facebook group.
These types of references typically aren’t captured by existing measurement solutions, but your customer remembers them. When multiple buyers surface the same source, that’s not anecdotal—it’s a signal.
Tools like Fairing help teams capture and operationalize these insights. A steady stream of buyer-reported responses turns into patterns. Patterns spark hypotheses. Hypotheses lead to tests. And soon, you’re not just reacting to performance, you’re optimizing it.
Validate instincts and redirect spend
Most marketing leaders already have a sense of what’s working. They sense momentum before it appears in dashboards.
Surveys help validate those instincts and build internal alignment around what to do next.
Suppose a community campaign feels like it’s driving interest, but performance data can’t prove it. In that case, survey responses showing it was the first moment of exposure permit you to double down.
Likewise, when leadership questions a top-of-funnel investment, survey data gives you a way to show impact, even if it doesn’t convert directly.
The key is framing. Don’t treat survey responses as anecdotal. Treat them as evidence of attention and influence that’s otherwise uncaptured. When that evidence points to a pattern, it becomes much easier to reallocate your budget with confidence.
Combine survey data with other metrics for stronger signals
Attribution surveys don’t work in isolation, and they’re not meant to.
The best use cases layer survey responses with other performance data to create a more complete picture. A few ways to triangulate:
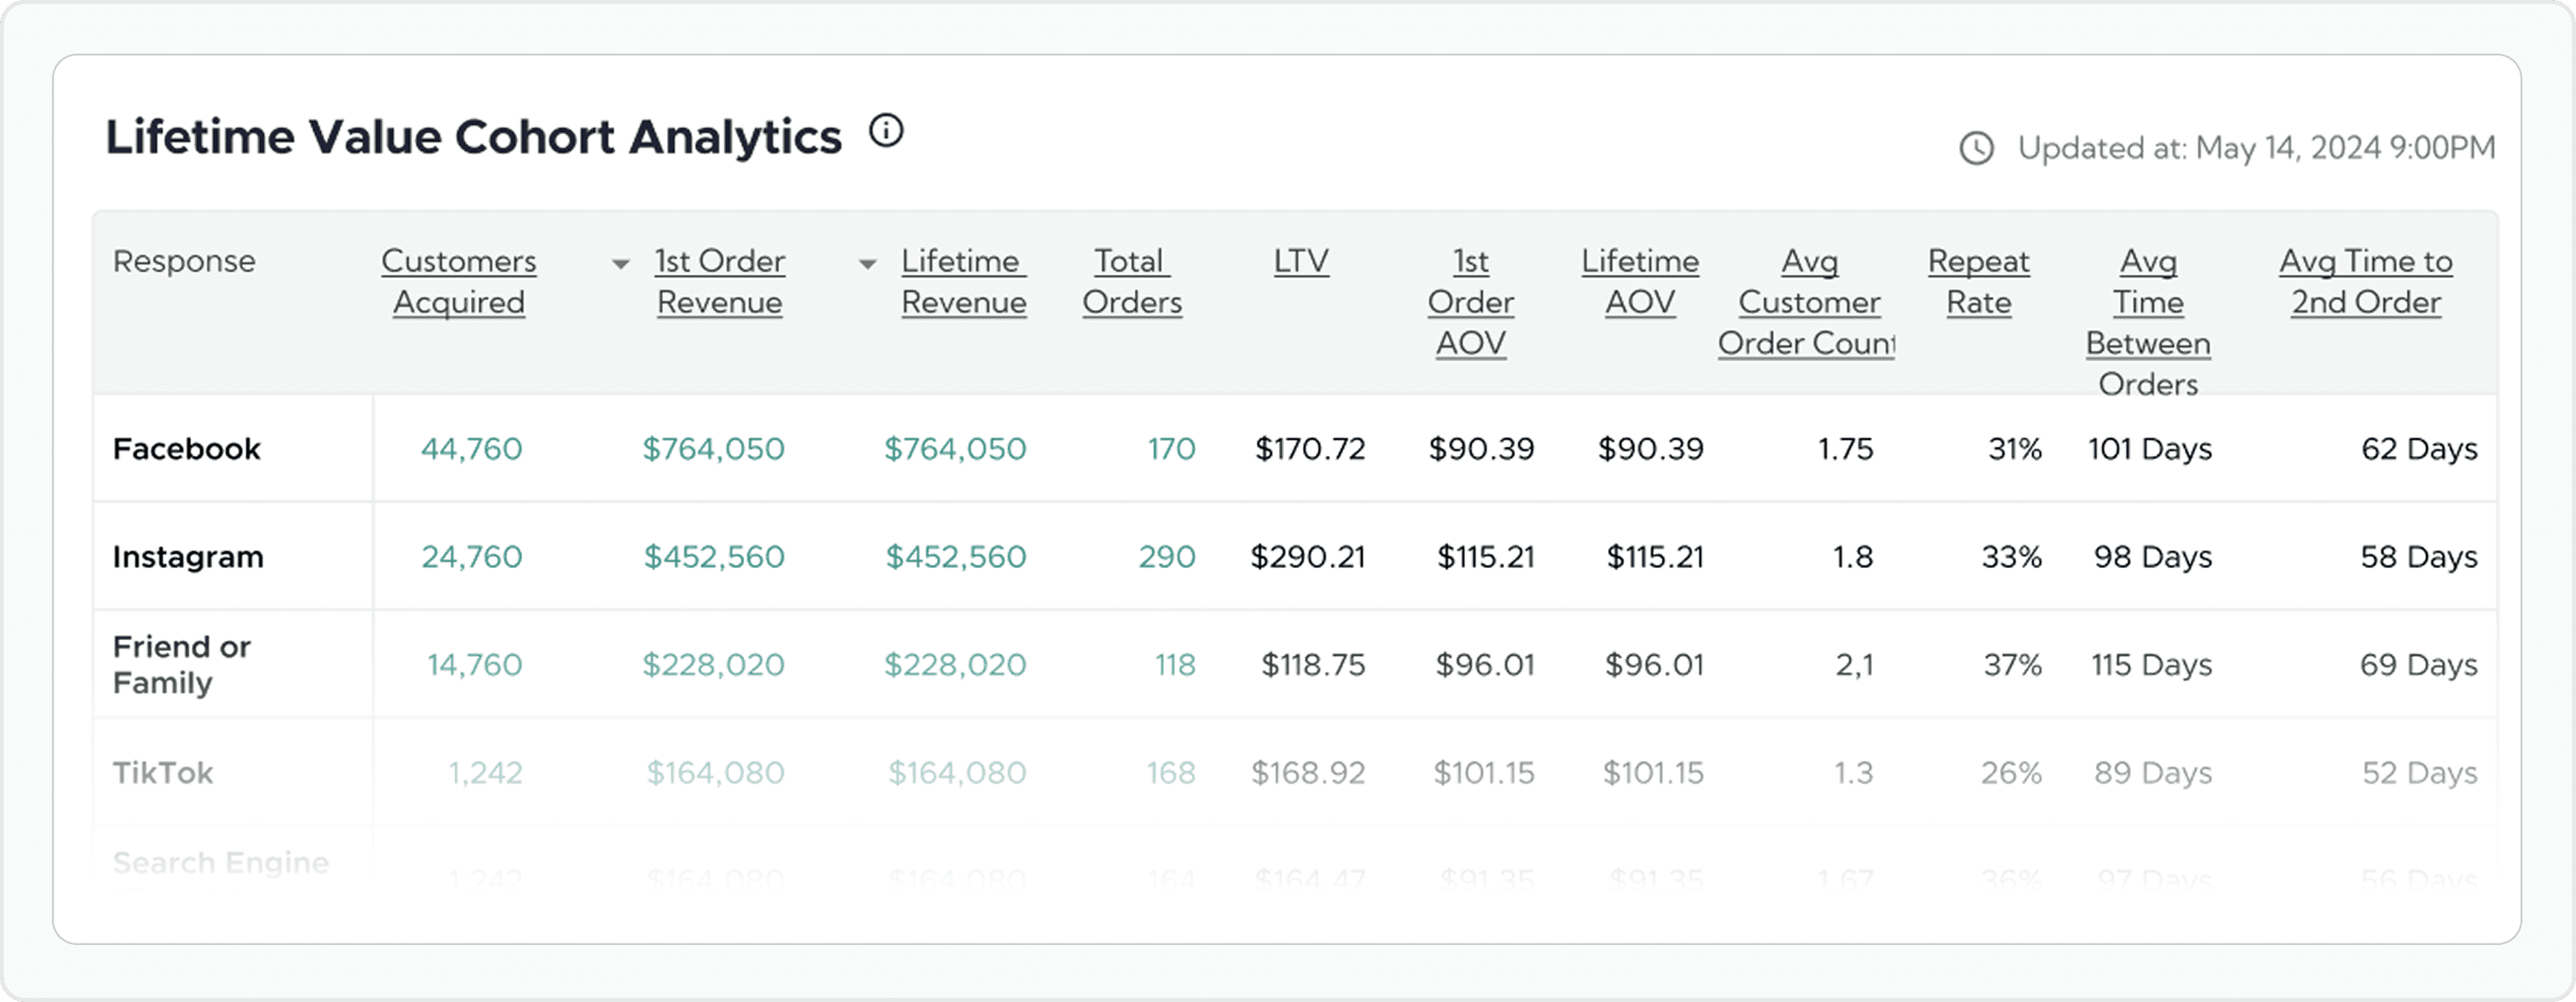
Match survey responses to customer LTV to identify which early-touch signals correlate with higher-value segments
Use incrementality testing to validate lift, knowing that exposure isn’t perfectly controlled, but survey data can fill in gaps left by partially exposed audiences or purchases with long consideration windows
Combine attribution survey data with clickstream analysis to understand the full path to purchase (e.g., a buyer hears about you on a podcast, then searches branded terms before converting)
This layered view does more than report performance. It tells a richer story.
Tired of guessing what “good” looks like?
Get channel-specific benchmarks, driven by self-reported attribution data, to help you set smarter goals and spot underperformers early.
Connect insight to creative, strategy, and segmentation
Survey data isn’t just for budget decisions. It’s a goldmine for messaging and audience development.
If customers consistently cite funny TikToks as their entry point, your next ad shouldn’t look like a static B2B slide deck. If they mention a specific creator or phrase, work it into your ad copy.
Attribution data gives you the language people use to describe your brand, so use it.
This insight also helps you rethink segmentation. If one group regularly cites podcasts and influencers while another points to brand moments or PR, that’s a clue about where trust begins and where your team can meet buyers earlier in their journey.
It can also inform how you think about customer quality: different first-touch sources may correlate with higher downstream LTV.
Give your team a clear decision path
Good survey programs don’t just surface data. They make it actionable.
That means defining what to do when you spot a trend. If 5-10% of buyers cite a certain channel over 30 days, is that the threshold for testing a budget shift? If an unexpected creative hook keeps showing up in free-text fields, does that trigger a copy test or landing page tweak?
Building these rules of thumb and socializing them internally helps your team move faster, with less friction. It also turns survey insight from something that’s “nice to have” into an actual operating signal.

How high-performing teams use attribution data |
|---|
|
Read on to see the most common mistakes that hold teams back, and what the highest-performing ones do to keep attribution survey data clean, trusted, and actionable.
CHAPTER 5
What High-Performing Teams Get Right, Plus 3 Common Pitfalls to Avoid
Attribution surveys can be one of the most powerful tools in your measurement stack, but only if they’re implemented and interpreted with care.
It’s easy to assume that once you’ve launched a clean, well-timed survey, the work is done. But in reality, sustaining a high-signal program means treating it as a living, evolving asset.
Even the most well-designed surveys can lose value if the data isn’t reviewed, reclassified, or used correctly. That’s why the highest-performing teams don’t just avoid mistakes, they build habits to prevent them from compounding.
Here are three common pitfalls that weaken the signal, plus how to avoid them.
Pitfall 1
Treating “Other” like a junk drawer
If 10% or more of your survey responses fall under “Other,” that’s not just noise. It’s an insight gap.
Too often, vague or missing options push people to select “Other,” even when their true answer is a common one.
When this happens, your dataset skews incomplete, and your team may overlook rising channels or miss the language customers use.
What high-performing teams do:
Monitor “Other” volume regularly and investigate any spikes
Reclassify frequently mentioned free-text entries and update answer choices accordingly
Consolidate duplicate or confusing options so respondents don’t have to guess
“Other” isn’t a failure. It’s a signal that your options need a refresh.

Pitfall 2
Ignoring what free-text fields are trying to tell you
It’s tempting to skim or skip open-text responses, especially when the volume is high or analysis feels manual. But that’s often where your richest insights live.
Free-text fields reveal emerging creators, surprise channels, creative themes, and unexpected hooks. They’re also the earliest warning system for shifting buyer behavior.
What high-performing teams do:
Review and pattern-match free-text entries monthly
Use AI or tagging systems to cluster mentions (e.g., by platform, creator, or topic)
Feed standout examples into campaign briefs, message testing, and segmentation strategies
The qualitative signal in free-text answers often reveals what your dashboard can’t.
Pitfall 3
Letting your taxonomy go stale
Customer behavior evolves. So does language. If your internal taxonomy doesn’t keep up, your reporting becomes disconnected from reality.
New channels, dark social trends, or changing slang can all muddy the data if you’re not regularly auditing how you classify and interpret responses.
What high-performing teams do:
Revisit and update your taxonomy at least quarterly
Track emerging channels and adjust categories to reflect them
Align internal terms with how customers describe their journey
A flexible, modern taxonomy helps your insights stay sharp and your reports stay trusted.

How to avoid common survey pitfalls |
|---|
|
CONCLUSION
Better Answers Start With Better Questions
If there’s one thing this guide should leave you with, it’s this: you don’t need to overhaul your stack. You need to fill in the gaps that it can’t cover.
Attribution surveys give you something no platform can: the buyer’s memory of what made them act. That context changes everything—how you allocate spend, shape creative, and build alignment across your team.
The strongest survey programs aren’t complex. They’re consistent. They ask the right people, at the right time, in the right way, and then they put that insight to work.
You’re not chasing perfection. You’re building a system that makes patterns easier to spot, feedback easier to act on, and smart decisions faster to make.
The more your team trusts the data, the easier it becomes to test new ideas, advocate for early-stage channels, and connect brand investments to business outcomes.
So don’t wait to get it perfect. Start with a single question and ask your buyers what moved them. Then, listen and let that insight lead.

Ready to capture what your dashboards can’t?
When marketers finally see the full picture, better decisions follow, and Fairing is how they get there.
👉 Book a demo or start your free trial today to uncover what’s truly driving demand and act on it.
Appendices
Attribution at-a-glance
Here are a few terms you’ll see throughout this guide. For a deeper dive into marketing channels and attribution survey best practices, check out Fairing’s channel dictionary.
Attribution gap
The blind spot between what marketers can track and what’s actually influencing buyer behavior. This gap has grown as privacy changes and off-platform discovery have made traditional tracking less reliable.
Attribution surveys
A direct method of asking customers how they discovered your brand or what influenced their decision. Unlike platform-based tracking, these surveys surface customer-reported signals that traditional tools often miss.
Attribution taxonomy
An internal classification system that organizes attribution responses into structured categories (for example, Paid Social, Influencer, Organic Search) so you can analyze and effectively act on insights consistently.
Downstream reclassification
The process of translating raw survey responses, especially open text, into structured, standardized categories that align with your attribution taxonomy. This ensures insights are usable across teams and systems.
Hard-to-measure (HTM) channels
Channels and discovery moments that do not leave clean digital trails. Examples include podcast mentions, word-of-mouth, TV ads, community chatter, creator content, and group texts.
HDYHAU
Short for “How did you hear about us?” This common survey question captures the first moment of brand awareness directly from the buyer.
Last-click models
A type of attribution model that gives full credit to the final touchpoint before a conversion. While simple, it often undervalues earlier touchpoints that sparked initial intent.
Marketing attribution
The process of identifying and assigning credit to the channels, touchpoints, and moments that contribute to a customer’s decision to take action, such as making a purchase.
Marketing Mix Modeling (MMM)
A statistical method that uses historical data to estimate the overall effectiveness of different marketing channels. Often used for high-level budget allocation, but does not capture user-level influence.
Measurement stack
The collection of tools, platforms, and methods a company uses to monitor performance and guide marketing decisions. This typically includes analytics platforms, attribution models, surveys, business intelligence (BI) dashboards, and testing frameworks.
Recency bias
A type of response bias in which customers are more likely to recall and report the most recent touchpoint they experienced, rather than the one that influenced them first.
Undercredited influence
The hidden impact of channels or moments that meaningfully shaped a customer’s decision but don’t appear in platform data. Attribution surveys help uncover these.
Is your attribution survey set up strategically and ready for decision-making?Use this self-audit to identify gaps and opportunities. |
|---|
Survey design
For example, “How did you hear about us?” close to the transaction, or “What led you to buy?” for longer consideration cycles.
Avoid jargon. Make it feel native to the experience.
Single-select with thoughtful follow-ups, not overwhelming lists.
Friction kills response rates. Make it seamless. |
Signal quality
Higher than that suggests it’s time to revisit your options.
Monthly pattern-matching helps surface emerging trends.
Especially for broad terms like “Instagram” or “Google.” |
Operational readiness
Does it reflect current platforms and buyer language?
So you’re not manually interpreting responses each time.
For example, dashboards, reports, CRM, or other tools your team uses. |
Strategic application
For example, if 10% of responses mention a new channel, do you test or reallocate budget?
Insights are only valuable if people trust and act on them.
Like LTV, CAC, or channel lift through triangulation or downstream analysis. |

