Offline Attribution Via Survey Methodology

Krystina Rubino
GM, Offline Practice
,
Right Side Up
This article is a collaboration between Fairing and Right Side Up. Learn more about RSU .
Smart marketers know the key to success is knowing your audience. Savvy marketers know the key to scale is knowing where your acquisitions came from. And knowing where your new customers came from in an advanced marketing ecosystem starts with a post-purchase survey, also referred to as “How Did You Hear About Us,” “How Heard,” “HDYHAU,” etc.
The brands that thrive in this fierce marketing environment are the ones that accurately attribute marketing dollars to customer revenue and use that insight to properly diversify their marketing spend. A post-purchase survey is a powerful tool, not only for offline attribution, but also for helping to ensure proper distribution of marketing dollars and impact of other digital channels, which have a tendency to be weighted too heavily if not properly monitored, leading to a lopsided marketing mix. Direct-from-consumer data requires that surveys be formed correctly to provide an accurate look while accounting for human behavior. With art (how we format and word survey questions) and science (the method of the math), a HDYHAU survey can allow your marketing team to confidently scale in offline (and digital) channels.
Fairing has seen clients gain upwards of 20% more attribution data by using surveys. This effectively lights up all the dark traffic that comes from “direct” or “unknown” sources in web analytics. It also adds unbiased context to the attribution data piped in by major media platforms who grade their own homework. Ultimately, it means the infamously hard to measure “halo” or cross-media performance from demand-generating channels like audio and TV become easier to quantify. It’s about adding measurement precision to the broader impacts of your marketing mix.
Right Side Up and Fairing have partnered on this guide because of our unique insight and tools to help you implement a survey correctly and measure your marketing results with confidence. Right Side Up is a collective of premium growth marketing talent, trusted by the most respected early-stage ventures, the fastest growing tech companies, and well-established Fortune 500 teams to do one thing better: growth. As one of the leading podcast and offline growth marketing practices, Right Side Up knows all too well the business intelligence gap for podcast and other offline channels. Despite the challenges inherent in these channels, Right Side Up has successfully built a portfolio of over 70 clients who have spent upwards of $60MM in the space in the last few years, and help others determine if they're ready to test podcast ads and diversify their marketing mix. A key to that success is building or using measurement tools from trusted partners, like Fairing–a powerhouse Shopify plugin for post-purchase surveys.
Why Ask a “How Did You Hear About Us” (HDYHAU) Survey?
Maybe a better question is, why don’t more advertisers implement a post-purchase survey as soon as possible? Digital-first marketing portfolios don’t need to rely on this measurement style, so survey based attribution is often encountered later on in the lifespan of a company when marketers dip their toes into offline advertising. Changing the measurement tactics later in the game can lead to doubt around the validity of any attribution methodology. It can be difficult to explain to internal stakeholders that your system of measurement for other media channels needs to be different for offline, and as advertisers, this is an all too common sticking point that can cause more confusion, not more insight, within an organization.
Many brands fear investing in offline media because of the breakage endemic to the channels. Indirect attribution on offline media is notoriously difficult to capture compared to its digital counterparts, given a lack of ad attribution methodologies like last-click or view-through. Even in instances where pixel-based tech is possible, lack of publisher and host/platform adoption and scale contributes to lack of confidence, not to mention the broader privacy concerns.
Industry best practices for offline growth marketing in many channels involve implementing a one- or two-question survey immediately post-conversion to help capture and qualify what drove a consumer to take our desired action, e.g. purchase, sign-up, subscription, etc. This allows for the measurement of total activity resulting from each channel, by measuring a percent of respondents and extrapolating to the total converting population. Podcast advertising is often the catalyst for implementing a survey, as it is commonly a channel D2C brands start with when expanding their media mix outside of digital channels, but other offline channels like TV, OTT, terrestrial and satellite radio often benefit (and scale) as a result of more confident attribution for all channels. Digital channel attribution (Facebook, SEM, Display, Online Video) can also be triangulated in this way as well; this is a good check on unified vendor-provided/”grading your own homework” reporting. It’s also a critical piece of the puzzle for many of our partners as they see degraded data quality from platforms like Facebook post-iOS 14.5 changes.
You may also wonder, if I want to understand multi-touch attribution, why not run a multi-touch attribution (MTA) study? Though they have risen in prominence and promise to answer the question of channel effectiveness, especially in relation to each other, execution often falls short. The practical realities of tagging all campaigns, and even more importantly, all touch points down the purchase funnel, is often challenging for brands to execute. Additionally, these studies are expensive and many brands find the investment is untenable compared to media expenditure. They are best implemented when media has scaled to a healthy, diversified marketing mix, and the cost can be absorbed and amortized, e.g. when scaled tactics like linear television are deployed.
How Do You Explain a Survey to Stakeholders?
Think of customer surveys as an attribution safety net for your marketing strategies. As you diversify and experiment with ad spend, some of the most advantageous and unique opportunities won’t offer a pixel-perfect attribution model. Instead, you solve it by talking to your customers.
That’s where the post-purchase survey comes in. By gathering direct-from-consumer data, surveys act as a Swiss Army knife for determining marketing attribution for almost any medium.
Let’s use podcasts as an example for how the post-purchase survey affects offline campaigns. Podcasts are primarily measured using promo codes or vanity URLs to track direct conversion, due to the breakage endemic to the channel. Because of how they consume the audio, the majority of listeners that are exposed to podcasts do not redeem through the vanity URL, rather through the main site or through other demand captures, like branded paid search, even though podcasts were their most impactful advertising touchpoint.
With our best practices and examples below, you’ll have a quick-start guide to implementing attribution surveys for a better performing, more diverse marketing mix.
Survey Setup
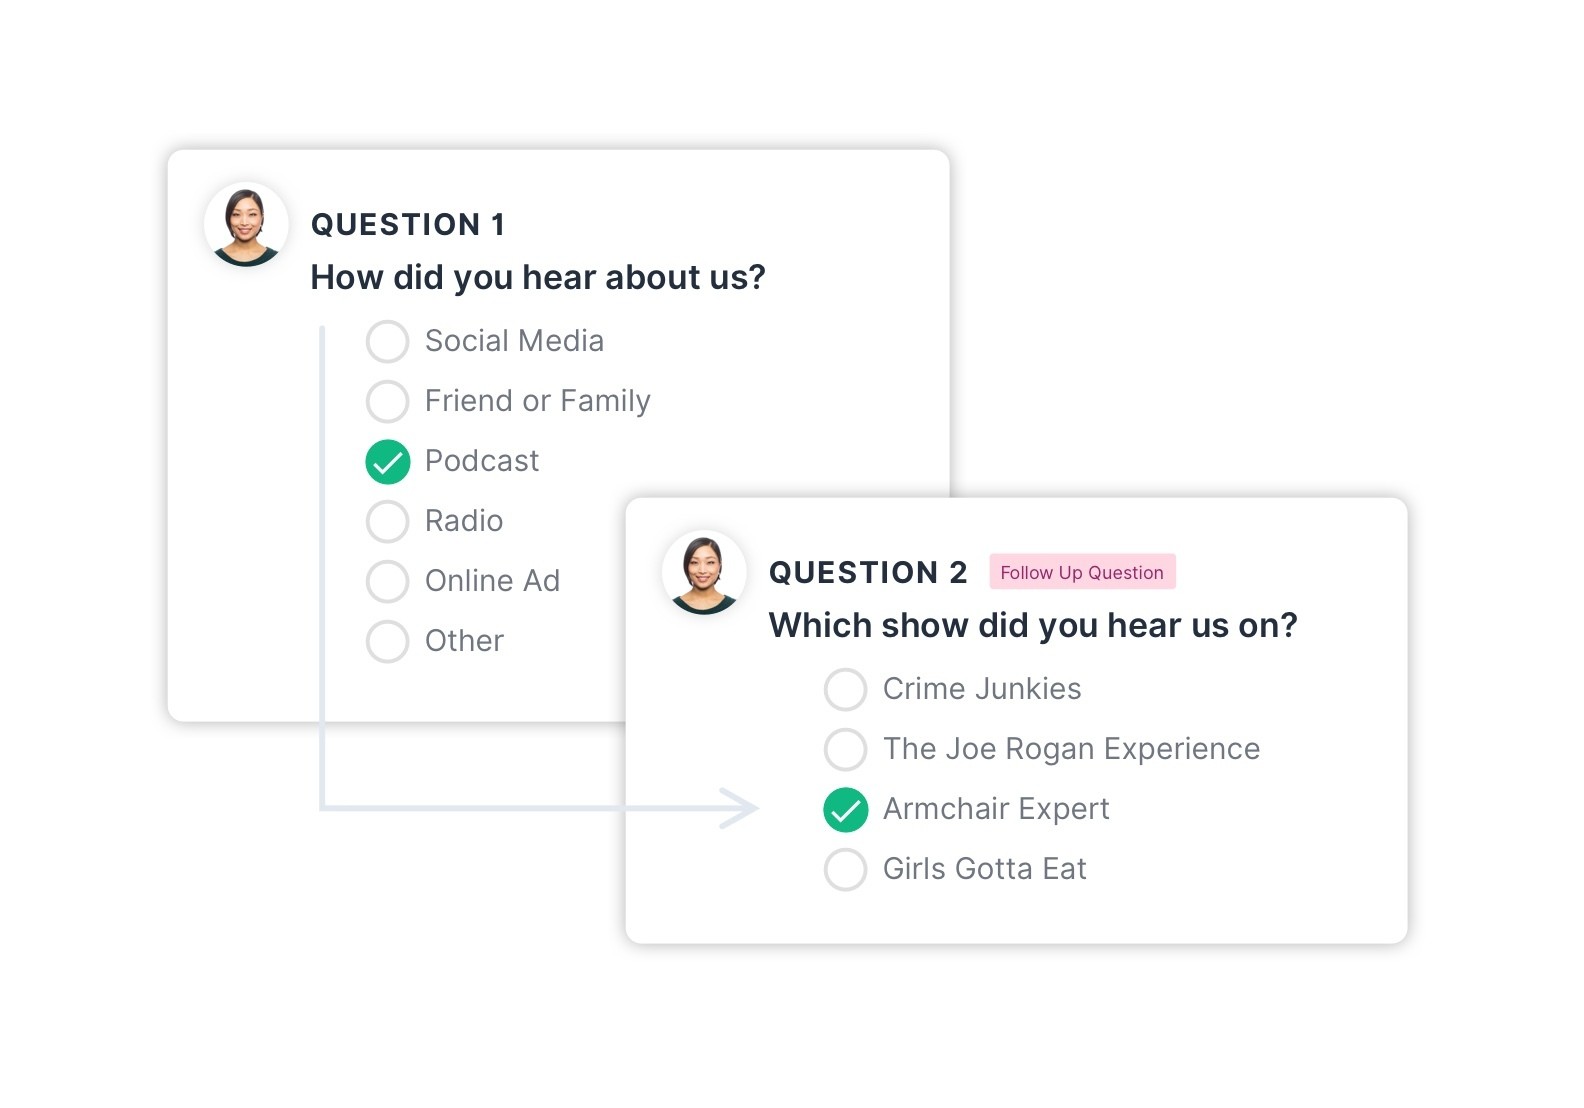
We recommend that marketing teams own survey setup and administration, via a turnkey survey platform, if possible. A survey solution can provide ease-of-use and data integrations provided by leading survey platforms afford marketing teams the flexibility to test iterations and gather new data with ease, while feeling confident in the results. Here is an example flow from Fairing, which can be built directly into your Shopify-based site.
Best Practices in Attribution Survey Setup
As you’ve seen in Fairing's example flow above, the survey is formatted in such a way to collect particular information while remaining unobtrusive to the customer experience. Below are more details around exactly how to format your own post-purchase survey and why it is important to adhere to best practices.
Attribution surveys should be delivered ASAP post-purchase or conversion, and optimally as an integrated experience within your website, app, or store. We recommend this for several reasons:
Selection bias. Delivering surveys via email can introduce an additional level of self-selection among your respondents, as less-engaged customers will be less likely to open the email or click on the survey request.
Sample size. Reaching statistical significance on your data is far easier when surveys are presented inline with the post-conversion experience. Fairing clients gather upwards of 5x more responses in an embedded post-purchase survey compared to typical email survey completion rates. A stable sample size means that the population that responded is a statistically significant representation of the entire customer acquisition universe. See next section for more information and a helpful calculator. (anchor link)
Memory decay. Attribution data integrity is fairly sensitive to memory decay, i.e. the degradation of someone’s memory over time. The longer you wait to ask a customer how they heard about you, the more likely you are to get inaccurate feedback. An emailed survey may take several days to gather a response, while a survey request inserted into product packaging could create a week or more of potential for memory decay.
Baseline removal is recommended to improve the accuracy of your survey data. This means adding in a not-yet-activated media channel into your attribution survey, preferably 30+ days before you start a campaign, to establish a baseline of incidental or invalid responses.
For example, running baseline removal for an upcoming podcast campaign might result in 0.5% of your customers selecting “podcast” despite you having no podcast campaign running; perhaps someone in your organization has previously done guest appearances on podcasts or a podcast host talked about your product organically. Knowing this, you can better calibrate your attribution data when results show 8% of customers selecting “podcast” in the midst of an active campaign, e.g. total customers selecting podcast would be adjusted to 7.5%, resulting in a more accurate CPA for the channel.
Effectively communicating your response choices can help ensure accuracy. Best practices here include a mix of user experience research and platform features. Streamline your options to make the survey easier for your customers to respond with minimal hesitation or confusion.
It’s highly recommended to provide an “Other” choice (with a text field to provide clarification). This data will often yield new insights about emerging opportunities for marketing mix diversification and can be difficult to learn through any other means.
The ability to ask a follow-up/clarification question is extremely valuable in keeping survey choices concise. For instance, “Social Media” could replace three or four specific channels, which may then be broken out by channel in the follow-up question.
Before solidifying your choices, ask several potential customers informally to explain what they think the choices mean. Depending on your audience and marketing mix, you may find that a choice like “Facebook ad” is a confusing starting point for respondents and a clearer approach could be the choice of “Facebook,” followed by more precise choices that include “ad.”
Wording matters, not only for streamlining the number of selections, but also to get accurate answers from respondents. It’s important not to rely on marketing acronyms or industry shorthand to get the most accurate responses.
Marketers know the difference between terrestrial radio and satellite radio, but a customer may only know they are listening to the radio in their car. It’s best to talk in layman's terms and provide examples to clarify, if needed. An example of this is internet-based radio, which you could format as “Streaming Radio (e.g. Pandora, iHeart)” or terrestrial radio as “AM/FM Radio.”
It’s important to note the benefit and risk, mentioned in the section above about the number of choices, of providing more granular options for the sake of clarity or specificity.
Survey choices should be based on a composite of paid channels and organic/earned channels to maximize the value of the data returned.
Brands that only offer paid media choices are missing their greatest reliable opportunity to gather attribution insights on unpaid market exposure.
Brands who fail to include organic channels lose valuable insight into your consumer audience and what activities drove them to convert now.
Surveys are typically multiple choice with only one selection allowed. Asking customers to select multiple attribution sources is a complex question that often yields less useful data and lower survey completion rates.
If you’re interested in gaining more attribution insight on your marketing funnel, using intentionally biased question language can solve for the two problems above. For instance, asking “How did you first hear about us?” and following the question with “What brought you to the site today?” will bias respondents towards reporting first touch and last touch, respectively.
Randomize survey choices to mitigate survey bias. For example, a static alphabetized list of choices will often result in overrepresentation of the first or second choice in your results.
If sending surveys via email, one suggested creative execution is to do it as part of a welcome overview/receipt/order confirmation email which includes a CTA for the survey. Ensure the CTA is clear and prioritized, rather than burying it inside a long or complex message. Making adjustments on the creative execution should result in changes to your sample size, so test/optimize as needed.
Make Sure Your Data is Stable
When measuring the efficacy of new media channels, Fairing clients typically start out by delivering the attribution survey to 100% of acquisitions. This coverage of the population, combined with the high response rates of Fairing post-purchase surveys (often 50%+), ensures statistical significance for most offline campaign investments right out of the box.
The goal of collecting statistically significant data here is to create stability for the next part of the multiplier calculation. The percent responding to a channel (“Podcast”) in the survey informs the actual total attribution for that channel, as reported directly by the customer. The population who did respond is the representation of the entire customer acquisition universe for that channel, so you must ensure that the surveyed population is statistically significant to make that validation. If you survey too few customers or have too low of a response rate, you risk skewing results with unstable data. Deliver the survey to as much of your customer base as possible to ensure you’re creating stable data.
If you still prefer to deliver an attribution survey to a smaller percentage of your customers, this sample size calculator by Fairing provides an understanding of the relationship between population (dependent upon your campaign investment and performance), confidence level (we suggest starting at 90%), and margin of error (which again, will be sensitive to the % of respondents reporting the offline channel).
As survey responses roll in, the relationship between margin of error and response results will inform whether you should continue delivering the survey to all new customers or if you can decrease delivery to 50% or 25%. That is to say: the larger an offline channel’s slice of the attribution pie (e.g. “Podcast”), the higher the margin of error can be—and the lower the sample size you’ll need to reach statistical significance. Therefore, calculating your sample size for minimum viable delivery is an ongoing pursuit, which is, in part, why many Fairing clients prefer to simply set delivery at 100% and forget it. An added bonus here is that “Other” responses in an attribution survey offer valuable insights into untapped channels, and a brand can never have too many of those responses!
Quantifying Indirect Activity and Marketing Attribution via Survey Methodology
From having a stable survey with statistically significant data, we infer the indirect activity from the total responses versus those who selected the channel being measured and then determine a multiplier to be applied to the direct activity. The multiplier acts as a way to right-size results for a particular channel based on the customer driven responses in the survey that indicated the total, attributable acquisitions. To determine this multiplier by channel, you must:
Identify the direct activity from your campaign, e.g. total population who followed the prescribed call to action from the ad (offline) or clicks (digital) and used a trackable promo code or URL for the channel.
Estimate the total population who converted (regardless of if they came in directly via promo code/URL or indirectly via the main site) as a result of the channel we are measuring, i.e. podcasts, by including the survey respondents who chose that response.
Direct Converters, e.g. via URL or promo code redemption
+ Indirect Converters, e.g. survey respondents indicating a particular channel
- Pre-Campaign Baseline, e.g. channel responses received pre-campaign
= Fully Attributed Audience
Once the fully attributable audience is determined using these inputs, the multiplier is representative of the difference between the direct acquisitions and the fully attributable acquisitions (direct and indirect). The multiplier that is calculated based on the survey should be applied to the total direct acquisitions for the full, attributed results.
Here's a pro forma marketing attribution funnel/exercise for a brand investing $100K in their first quarter of podcast advertising, and how their survey data creates the multiplier for the podcast channel.
Sample Podcast Attribution Using Survey Data + Promo Redemptions
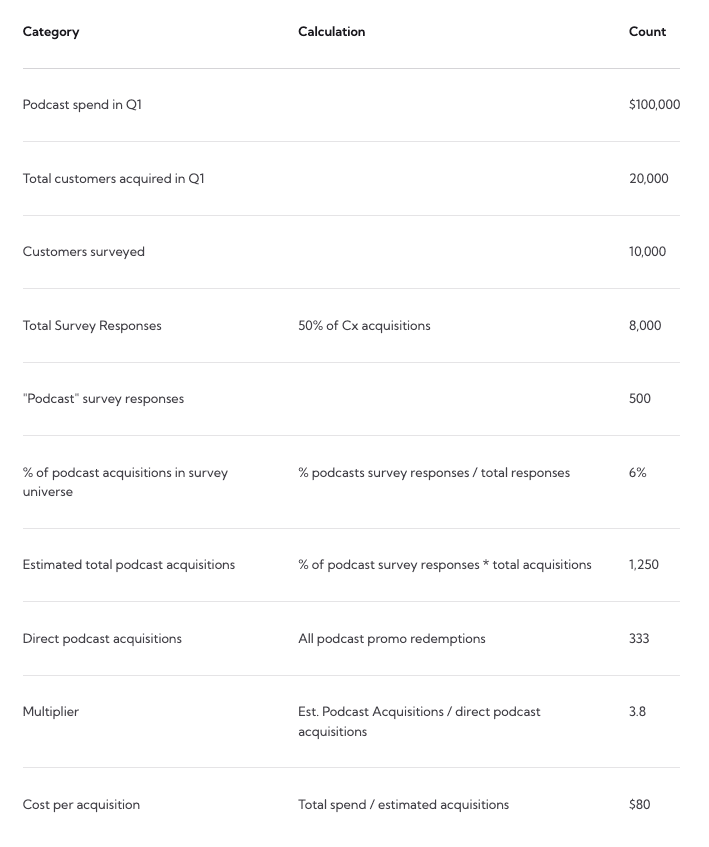
In this example, if 6% of survey respondents selected “podcast” as their response, then approximately 6% of all conversions (1,250) were driven by podcasts. If you ran the survey before the media went live, this is also the point at which you execute baseline removal, e.g. reducing the % of podcast acquisitions in the survey universe down by the baseline amount. This 6%, or 1,250, is indicative of the total podcast acquisitions, which includes both indirect and direct acquisitions. Because we know the direct acquisitions (333) and what the total attributable acquisitions should be (1,250), we use the multiplier to show the indirect attributable impact. To calculate this multiplier, take the total podcast acquisitions divided by the direct podcast acquisitions. More simply, if you multiply your direct podcast acquisitions (333) by 3.8x (the multiplier calculated above) you achieve the total number of 1,250 acquisitions that should be attributed to podcasts. Without this multiplier, 333 direct podcast acquisitions is only representative of 1.6% of total acquisitions, far less than the customer-reported 6%. Direct acquisitions are not removed from the total survey responses, as the multiplier serves to fill in the gap to the fully attributable total, and this method of measurement requires that there is direct activity to apply a multiplier to. The multiplier is the key to an extrapolation of what the total campaign attribution would be if the survey was delivered to 100% of the population and had a 100% response rate.
Survey results, and multipliers, will vary week to week, as your marketing spend varies week to week and different channels take different lengths of time for results to age in. To account for the weekly fluctuation, we look at a rolling time period to normalize the highs and lows of weekly multipliers to come to an average. For example, one week a multiplier may be 1.9x and then 16x the next. Instead of choosing to go with the higher or lower multiplier, looking at an average provides a fuller picture of attribution over the campaign. We typically recommend brands use a quarter as their designated time period to set the average multiplier by channel and refresh multipliers on a minimum of a quarterly basis, more or less often if there are other business considerations, e.g. periods of enhanced marketing that may skew results, product changes that de-emphasize the survey, etc.
How Does This Methodology Help Inform Marketers’ Decision-Making?
In the above marketing attribution funnel, only calculating CPA on direct activity would leave out attributable activity in the channel. Right Side Up has found that this is one of the quickest ways to a false negative for podcast advertising. In this example, the CPA for podcast would have been calculated at $300 based on direct activity alone, versus the fully attributed value of $80. Even if the CPA were still tolerable, scale would still be impacted negatively as fewer shows and properties would be renewed. Thus, you would need to continue at a high rate of iterative testing just to find the few shows that are super-performing compared to their counterparts, versus building a stable portfolio of shows driving a combination of volume and efficiency that provides meaningful customer acquisition scale for your business. This not only would skew your podcast results and ability to scale, it would also impact your decision making for other channels.
Channels with stronger last-click attribution are often adjusted by this survey data. As an example, paid search is a perennial top performer as it is a demand capturing channel. It is often the most credited for consumers reached via other channels who forget the path to action from their original ad exposure, and inevitably know that—like everything else!—if they search for what they need, Google has the answer. Knowing that the customer path is prone to breakage for offline channels, you are likely to see an uptick in search activity and over-credit activity to that channel. In using the survey, you gain a better perspective on how search might not be the correct channel to attribute activity and divide the credit to the proper channels.

With this knowledge, you can make better decisions about your marketing mix by determining what is working best for your customer acquisition efforts for not only offline, but for digital channels as well.
How Does This Approach Help Optimize Your Paid Media Campaigns?
The information gathered from a post-purchase survey affects your look into overall channel attribution across your marketing portfolio, and, more importantly, for optimization of show-level performance.
For example, let’s say you have determined that your CPA goal for offline campaigns is $40, based on your overall customer acquisition cost targets, where other paid media channels are netting, etc.
You decide to run a test campaign on The Coolest Show Ever for a total $10,000, and from the test you see 127 direct acquisitions from promo code redemptions for code COOL, the call to action the hosts provide in the ad, for a CPA of $79. Given it is almost 2x your CPA goal, you are unlikely to renew this show, because it did not come anywhere close to hitting your performance goals. However, we know that not all listeners of The Coolest Show Ever, despite every effort of the hosts, will use the vanity URL and come in a different way, e.g. by searching for “Advertiser Name on Coolest Show Ever,” etc.
Using the survey, you will still be able to identify what customers came in indirectly, via other channels and captures, but attribute “podcast” as the impetus for their conversion/how they “heard” about your brand. With the calculation from your survey, using the methodology we outline above and removing baseline responses, you determine that there should be a 4X multiplier on all direct podcast conversions.
The Coolest Show Ever was previously at a CPA of $79, but with a 4x multiplier, it now shows 508 attributed conversions. 508 conversions against $10,000 in spend now comes out to a $20 CPA, well below your goal and on a fast track to be one of the most efficient core shows as you continue to test and scale channels like podcast advertising as a consistent, profitable acquisition tactic for your business.
Conclusion
Marketing programs at nearly any scale can only benefit from incorporating a post-purchase survey into their measurement methodology. In a competitive advertising environment where consumers are hit with messaging from many touchpoints, marketers must ensure their measurement reflects the complexities of multi-channel campaigns. In creating two-way communication between the brand and the customer by way of a post-purchase survey, we find extremely valuable insights to bring marketing campaigns to the next level.
Whether you’d like to learn more, or are ready to incorporate a post-purchase survey on your website, visit Fairing.co to take the next steps. If you’re curious about how to incorporate offline channels into your marketing mix, but need expert advice on where to start and/or an experienced team to help, email growth@rightsideup.co to find out how Right Side Up can partner with you.
Want to learn how to set up your post-purchase survey for your brand? Read more here.
