How to Recreate Google UA’s Source/Medium Report in GA4 for Ecommerce
If you run an ecommerce business, you know how important it is to track
and analyze your website traffic. One of the most useful reports for
understanding your website visitors is Google Universal Analytics' (UA)
Source/Medium report. However, if you've recently made the switch to
Google Analytics 4 (GA4), you may be wondering how you can recreate this
vital ecommerce report in the new platform.
In this blog post, we'll show you two different methods for recreating
Google UA's Source/Medium report in GA4 for ecommerce. We'll also
explain the benefits of rebuilding this report for brands, and provide
an overview of the similarities and differences between the two methods.
Benefits of UA's Source/Medium Report in GA4 For Ecommerce:
Google UA's Source/Medium report is a valuable tool for ecommerce
companies to understand where their website traffic is coming from. With
this report, you can see which sources are driving the most traffic to
your site and which sources are underperforming. This information can
help you optimize your marketing efforts and improve your website's
overall performance.
However, the Source/Medium report is not available in GA4 by default. To
access this report, you'll need to recreate it using one of the
following methods.
Method 1: Adjusting Your "Traffic Acquisition: Session Default Channel Group" Report
The first method involves adjusting your existing "Traffic Acquisition:
Session Default Channel Group" report. This method is quicker to set up
and can be saved as a report in your Reports section with the ability to
create Summary cards for a snapshot of your report. However, this method
doesn't offer as much customization as the second method.
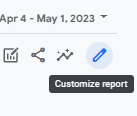
To start, open your "Traffic Acquisition: Session Default Channel Group"
report and click "Customize Report" in the top right corner.
Then, click on "Dimensions" and change your default dimension to
"Session Source/Medium" (add it if it's not already there and set it as
the default), and click "Apply."
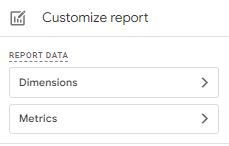
From the "Customize Report" menu, you can navigate to the Metrics
section where you can add, remove, or rearrange metrics.
In the "Customize Report" menu you can also add filters to adjust the
data.
Lastly, save the report by either replacing the current "Traffic
Acquisition: Session Default Channel Group" report or creating a new
one.
However, keep in mind that this method doesn't provide a high degree of
customization with the data in the visuals. So, let's take a look at the
second method.
Method 2: Creating an Exploration with a Greater Degree of Customization
The second method is a bit more complex, but it offers a greater degree
of customization.
To do this, go to “Reports” in GA4, then open the “Acquisition” tab on
the right-hand side. Select “Traffic Acquisition” from the drop-down,
then click “Edit comparison”.
Once you have the “Edit comparison” window open, hit the “Explore”
button in the bottom right-hand corner. This rebuilds the data in the
Traffic Acquisition report in the Explore section, which saves you the
time of having to build a starting point yourself. This allows you to
move the data around and put filters on it in a way that makes sense to
you.
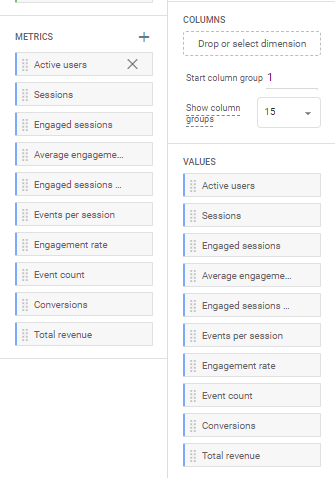
You can then change the data points you see by adding or removing
metrics from the “Metrics” section to the “Values” section on the
left-hand side of your view. You can also change the order of the
columns by rearranging the “Values” section.
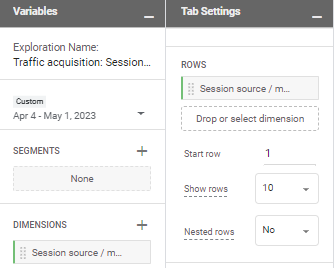
By default, the report will be organized by “Session default channel
grouping”. You can change that by clicking to add a Dimension on the
right-hand side, then searching for “Session Source / Medium” and
importing that into the staging area. Once you have “Session Source /
Medium” in the staging area, you can replace the value in the “Rows”
section by dragging over “Session Source / Medium” and removing “Session
default channel grouping”.
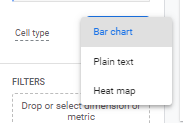
You’ll notice that by default, it has bar charts on the values in the
columns. You can change that by adjusting the “Cell Type” value below
the Values section. Your options are Bar chart, Plain text, and Heat
map.
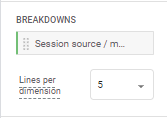
On the other tabs, you can see the visualizations that were in the
Traffic Acquisition report. If you just want to look at one value in the
line graph visualization, you can just remove the value in the
“Breakdowns” section. And it rebuilds the visualization without that
Breakdown.
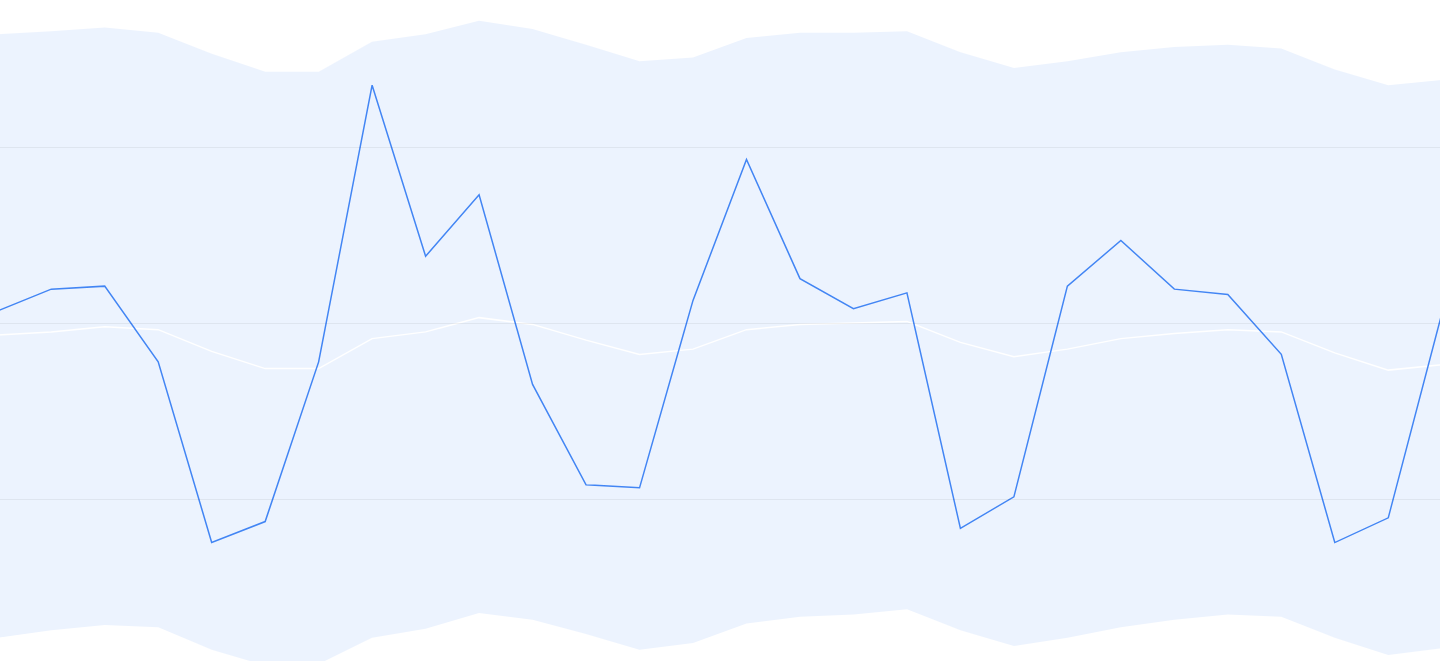
Once your breakdowns are removed, you can also add in Anomaly detection
by changing the Training period to the last 90 days or whatever time
frame makes the most sense to you. Then you’ll be able to see when you
have abnormally low or high traffic by if it leaves the range shown.
From then on, your Session Source / Medium exploration will be available
in the “Explorations” tab in GA4.
Conclusion
While the UA’s Source / Medium report is no longer available in GA4, it
can still be recreated using the Report and Exploration tool. We hope
this blog has been helpful in outlining the steps involved in recreating
this report, and that it will prove useful to ecommerce businesses
looking to measure and analyze their online performance.